



GBP/USD, DJIA Price Outlook: Key Scenarios Amid Rate-Hike Risks
Key scenarios to watch on the GBP/USD and DJIA charts amid rate-hike risks and a potentially hawkish FOMC decision tonight. These factors are supporting risk-off sentiment alongside strong trends across energy markets and U.S. Treasury yields.
Share this:

Key scenarios to watch on the GBP/USD and DJIA charts amid rate-hike risks and a potentially hawkish FOMC decision tonight. These factors are supporting risk-off sentiment alongside strong trends across energy markets and U.S. Treasury yields.
Key developments in focus include:
- The DXY is still holding its ground above the 98.50 support level, limiting gains across currency markets. USD/JPY, DXY Outlook: Short-Term Weakness, Long-Term Strength?
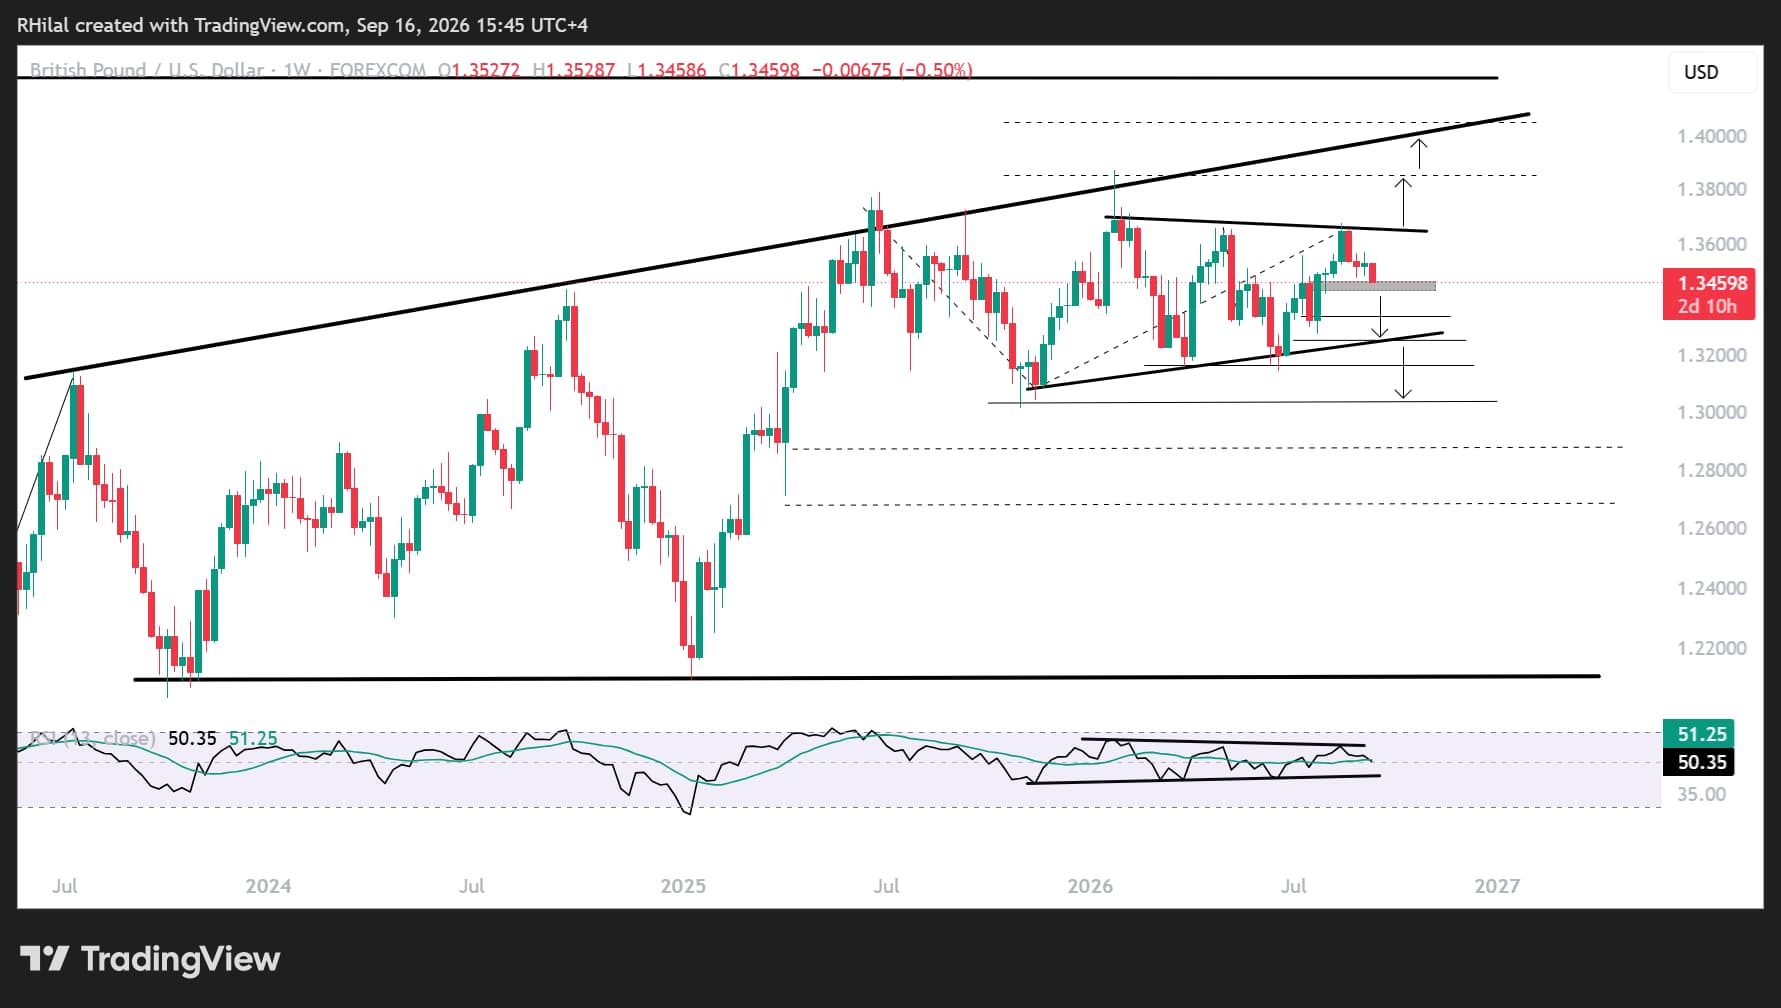
- GBP/USD gains were capped below the 1.3680 resistance level and the upper boundary of the yearly contracting consolidation, signallng a short-term bearish bias.
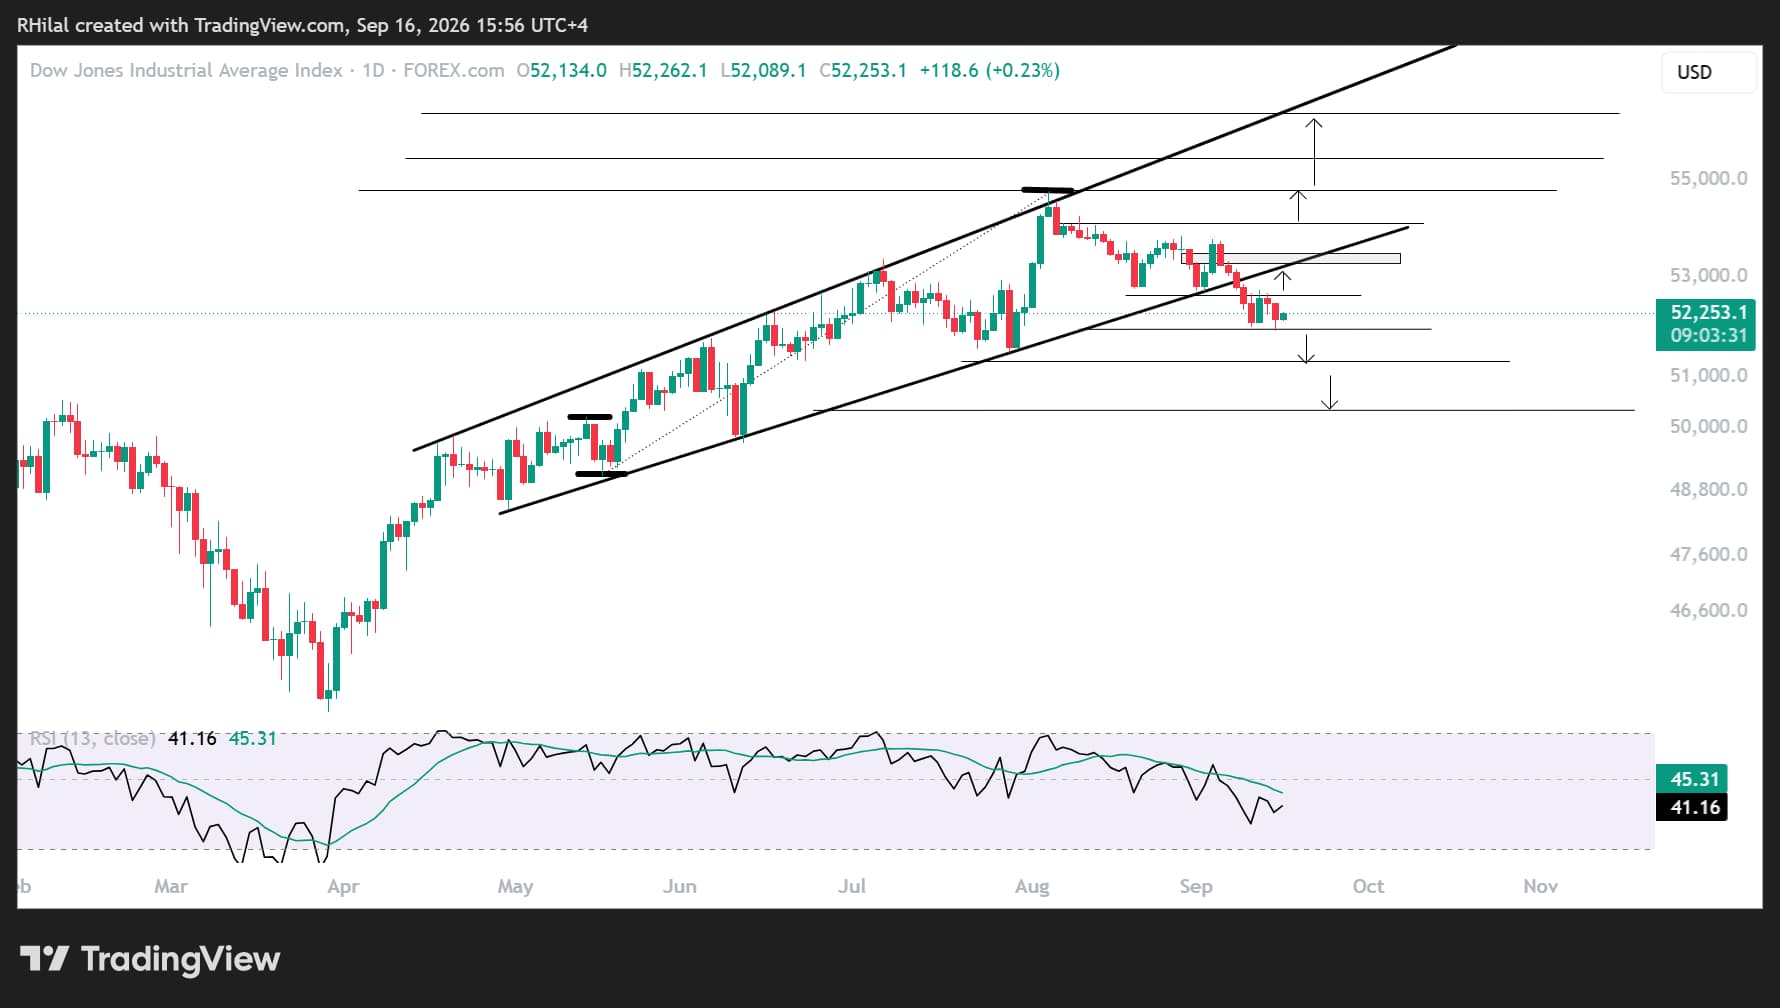
- The Dow Jones is still holding below the boundaries of its April–September 2026 uptrend, also signaling a short-term bearish bias.
- The probability of a 25 bps rate hike tonight is above 90% (CME Fed Watch Tool)
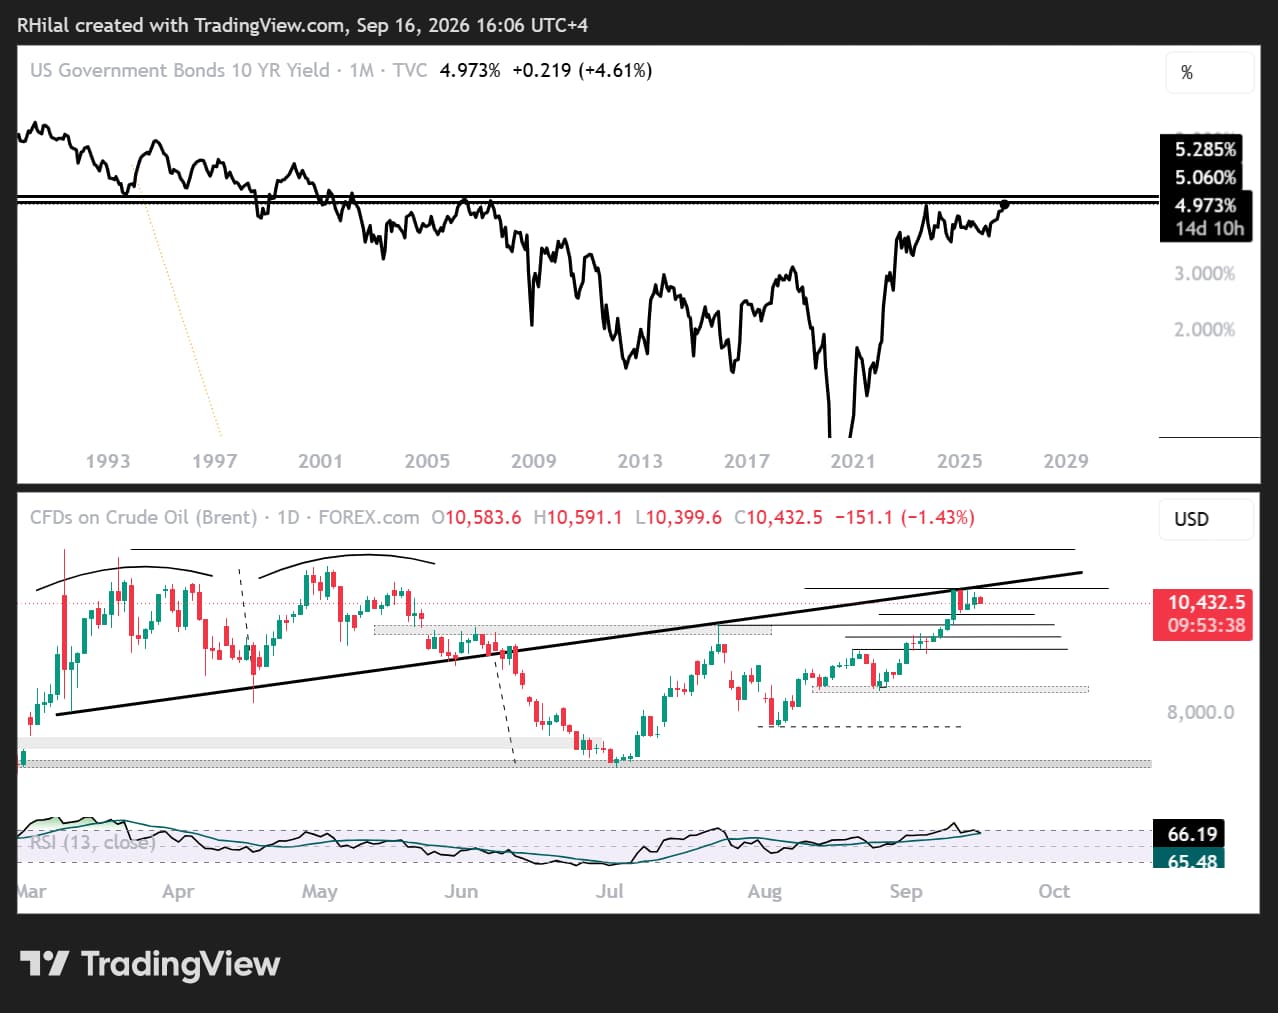
Before reviewing the key scenarios for the pound and the Dow, it is worth noting the stretched price action in the U.S. 10-year Treasury yield, which is testing highs last seen in 2007 while daily momentum reaches overbought levels last seen in 2023.
At the same time, the UKOIL chart is testing yearly momentum highs, with overbought risks increasing as price action approaches a critical resistance and 7-month confluence zone.
US10Y Yield and UKOIL — Log Scale
Source: TradingView
These charts are being monitored ahead of the FOMC to assess the potential pullback risk across the broader escalation narrative.
Should both charts continue higher, particularly if UKOIL breaks above 108, risk-off pressure may persist across markets.
I analyze these set ups in more detail in my weekly webinars
Register here for the next webinar
Now back to the GBPUSD and Dow
GBP/USD Forecast: Weekly Time Frame — Log Scale
Source: TradingView
Throughout the year, the GBP/USD pair has traded within the boundaries of a contracting consolidation below the 1.38–1.3680 resistance zone.
The latest rebound in the DXY above the 98.50 support level coincided with another pullback in GBP/USD from the upper boundary of the consolidation, reinforcing the short-term bearish outlook.
A breakdown below the 1.3430 support level would accelerate the decline toward the lower boundary of the consolidation near 1.3340 and 1.3240.
These levels are defined using the Fibonacci extensions of the wave spanning July 2025, November 2025 and July 2026.
On the upside, a breakout above 1.3580 and 1.3680 would be required to confirm bullish continuation toward the 1.40 zone.
DJIA Forecast: Daily Time Frame — Log Scale
Source: TradingView
From a daily perspective, the Dow Jones is still holding below the uptrend support line that has been in place since the April 2026 lows.
The index is also holding above the 50% Fibonacci retracement of the May–August advance near 51,900.
Bearish scenario: A breakdown below 51,900 would target the 61.8% and 78.6% Fibonacci retracement levels near 51,200 and 50,300, respectively.
A sustained move below these levels would increase the risk of a broader bearish outlook for the year.
Bullish scenario: Reclaiming 52,600 and 52,400 would support the continuation of the bullish bias toward 54,000 and the yearly highs near 54,800. these levels are defined via the Fibonacci extension tool of the May-August-September wave.
A move above that level would reinforce the uptrend and expose the trendline connecting the higher highs since April 2026, near 57,000.
The Fed’s tone and crude oil’s price direction will likely play a key role in shaping the next potential market trends.
Written by Razan Hilal, CMT
Follow on X: @Rh_waves
Related tags:
Latest market news




Open an account in minutes
Experience award-winning platforms with fast and secure execution, and enjoy tight spreads from 0.5 pts on FX and 0.3 pts on indices.
Economic calendar
Web Trader platform
Our sophisticated web-based platform is packed with features.
Related articles
British Pound Technical Outlook: GBP/USD Bulls Fight to Stabilize at Critical Support 10 13 2026
GBP/USD is compressing into a tight near-term range just above key support, with a breakout likely to provide the next directional cue.


GBP/USD, XAU/USD Forecast: Two trades to watch
GBP/USD rises amid a weaker USD, but gains could be limited. Gold rises as Oil, Treasury yields slip, central bank buying remains strong.


GBP/AUD falling wedge points to bullish breakout risk ahead of RBA minutes
GBP/AUD is forming a potential bullish continuation pattern, with RBA minutes, Australian unemployment and Bank of England commentary among the catalysts that could spark a breakout.

This report is intended for general circulation only. It should not be construed as a recommendation, or an offer (or solicitation of an offer) to buy or sell any financial products. The information provided does not take into account your specific investment objectives, financial situation or particular needs. Before you act on any recommendation that may be contained in this report, independent advice ought to be sought from a financial adviser regarding the suitability of the investment product, taking into account your specific investment objectives, financial situation or particular needs.
StoneX Financial Pte. Ltd., may distribute reports produced by its respective foreign entities or affiliates within the StoneX group of companies or third parties pursuant to an arrangement under Regulation 32C of the Financial Advisers Regulations. Where the report is distributed to a person in Singapore who is not an accredited investor, expert investor or an institutional investor (as defined in the Securities Futures Act), StoneX Financial Pte. Ltd. accepts legal responsibility to such persons for the contents of the report only to the extent required by law. Singapore recipients should contact StoneX Financial Pte. Ltd. at 6826 9988 for matters arising from, or in connection with the report.
In the case of all other recipients of this report, to the extent permitted by applicable laws and regulations neither StoneX Financial Pte. Ltd. nor its associated companies will be responsible or liable for any loss or damage incurred arising out of, or in connection with, any use of the information contained in this report and all such liability is hereby expressly disclaimed. No representation or warranty is made, express or implied, that the content of this report is complete or accurate.
StoneX Financial Pte. Ltd. is not under any obligation to update this report.
Trading CFDs carries a high level of risk that may not be suitable for some investors. Consider your investment objectives, level of experience, financial resources, risk appetite and other relevant circumstances carefully. The possibility exists that you could lose some or all of your investments, including your initial deposits. If in doubt, please seek independent expert advice. Visit www.forex.com/en-sg/terms-and-policies for the complete Risk Disclosure Statement.