





Gold hesitates at its ATH, USD drifting higher towards 105: Asian Open
Gold may have printed a record high on Monday, but with a gold basket hovering below resistance and the USD drifting higher, perhaps gold’s rally may at least pause for breath - if not retrace lower.
Share this:

- The US dollar index crept higher alongside US yields on Monday ahead of Wednesday’s FOMC minutes, which saw AUD/USD form a bearish outside day after another false break of 67c
- NZD/USD also formed a bearish outside day, USD/JPY and USD/CHF rose for a third day – although the moves appear to be more on the general flow of markets as opposed to being driven by a fundamental catalyst
- It was a mixed start to the week on Wall Street with the Nasdaq 100 closing at a record high, the S&P 500 closing flat after failing to break above Thursday’s record high and the Dow Jones forming a bearish engulfing candle despite forming an intraday record high earlier in the day
- The Nasdaq was the top performer thanks to bets of another blowout earnings report for Nvidia (NVDA) on Wednesday
- Ether (ETHUSD) spiked 10% on Monday on reports that the SEC could approve spot Ether ETFs later this week, which helped Bitcoin (BTCUSD) rose over 3% and retest 70k
- Gold prices sneaked in a cheeky record high ahead of China's open on Monday. Yet as the move has not been confirmed with by a weaker US dollar, it seems have been caught a tailwind from higher metals futures on China's exchanges
- China has vowed to prohibit some US forms from importing and exporting activities to China in retaliation for the US significantly rising tariffs in some Chinese exports to the US last week
Economic events (times in AEST)
- 09:00 – FOMC member Bostic speaks
- 10:30 – Australian consumer sentiment (Westpac)
- 11:30 – RBA meeting minutes
- 13:00 - New Zealand credit card spending
- 16:00 – German producer prices
- 18:00 – US Treasury Secretary Yellen speaks
Gold technical analysis:
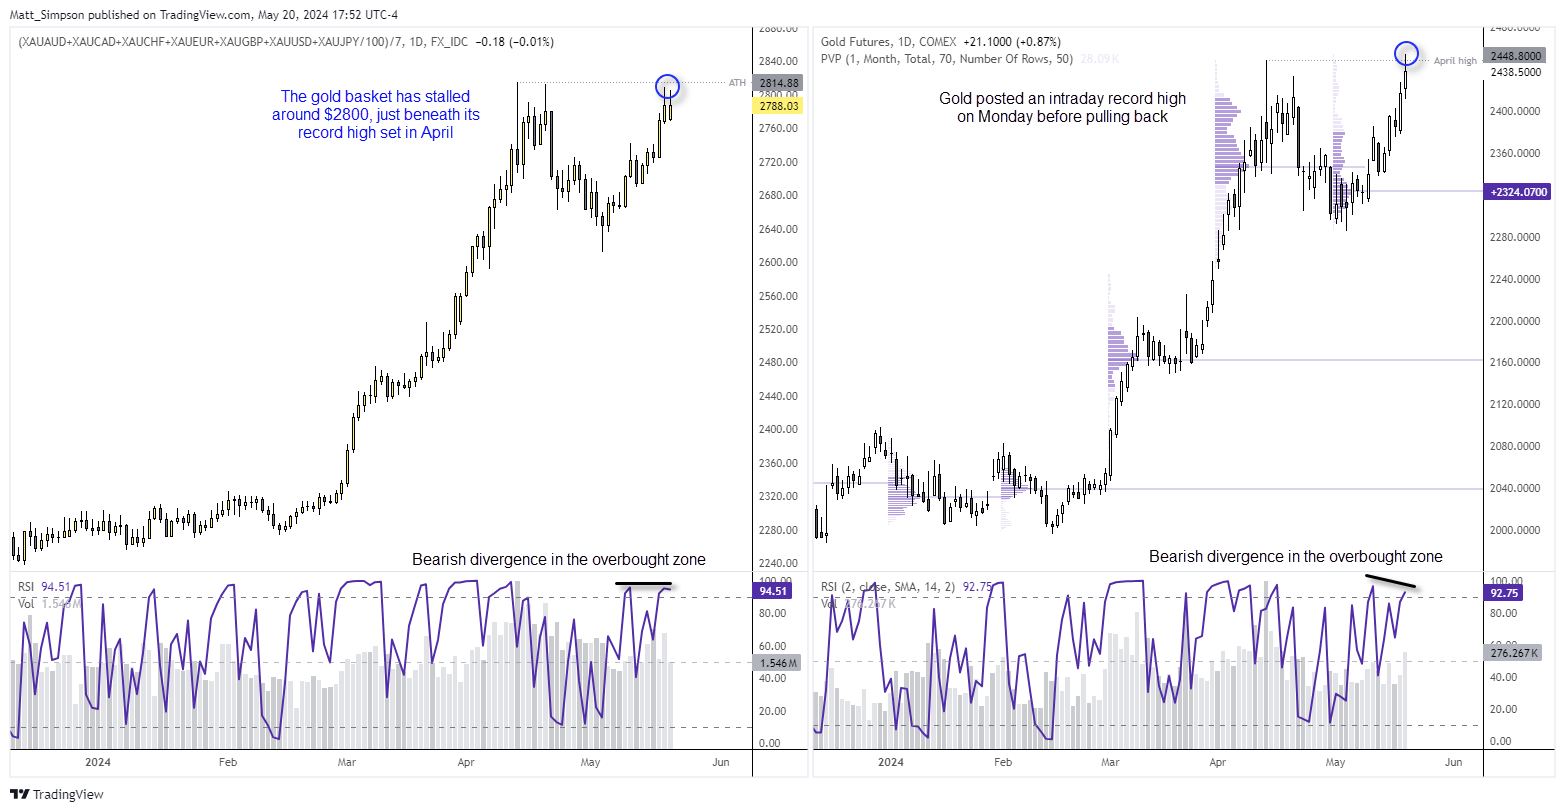
The left chart shows an equally-weighted gold basket of spot gold against FX majors. It aims to show the underlying of strength of gold in general, and dilute the inverse relationship between gold and the US dollar – which is the most widely followed gold market. On the right we can see the gold futures (gold/USD) reached a record high on Monday alongside higher trading volume, although it failed to hold onto gains above $2450 or the prior record high and retraced lower.
It is also interesting to note that the gold basket has stalled around $2800, just beneath its own record high set in April. A bearish divergence has also formed on the gold basket and gold futures contract, both of which are in the overbought zone.
It may be difficult to construct an immediate bearish case other than gold stalling around key resistance levels. But that can be good enough for gold bulls to take note and err on the side of caution.
We’ve already seen once false break of the April high for gold futures, so perhaps bulls may want to at least see the gold basket break to a new record high before assuming gold futures will hold on to gains. Of course, what could help with the latter case is to see the US dollar index break and hold below 104. Otherwise, another approach is for bulls to wait for a retracement before seeking evidence of a higher low for bullish swing trade at a more favourable price, in anticipation of a break to a new record high.
US dollar index (DXY) technical analysis:
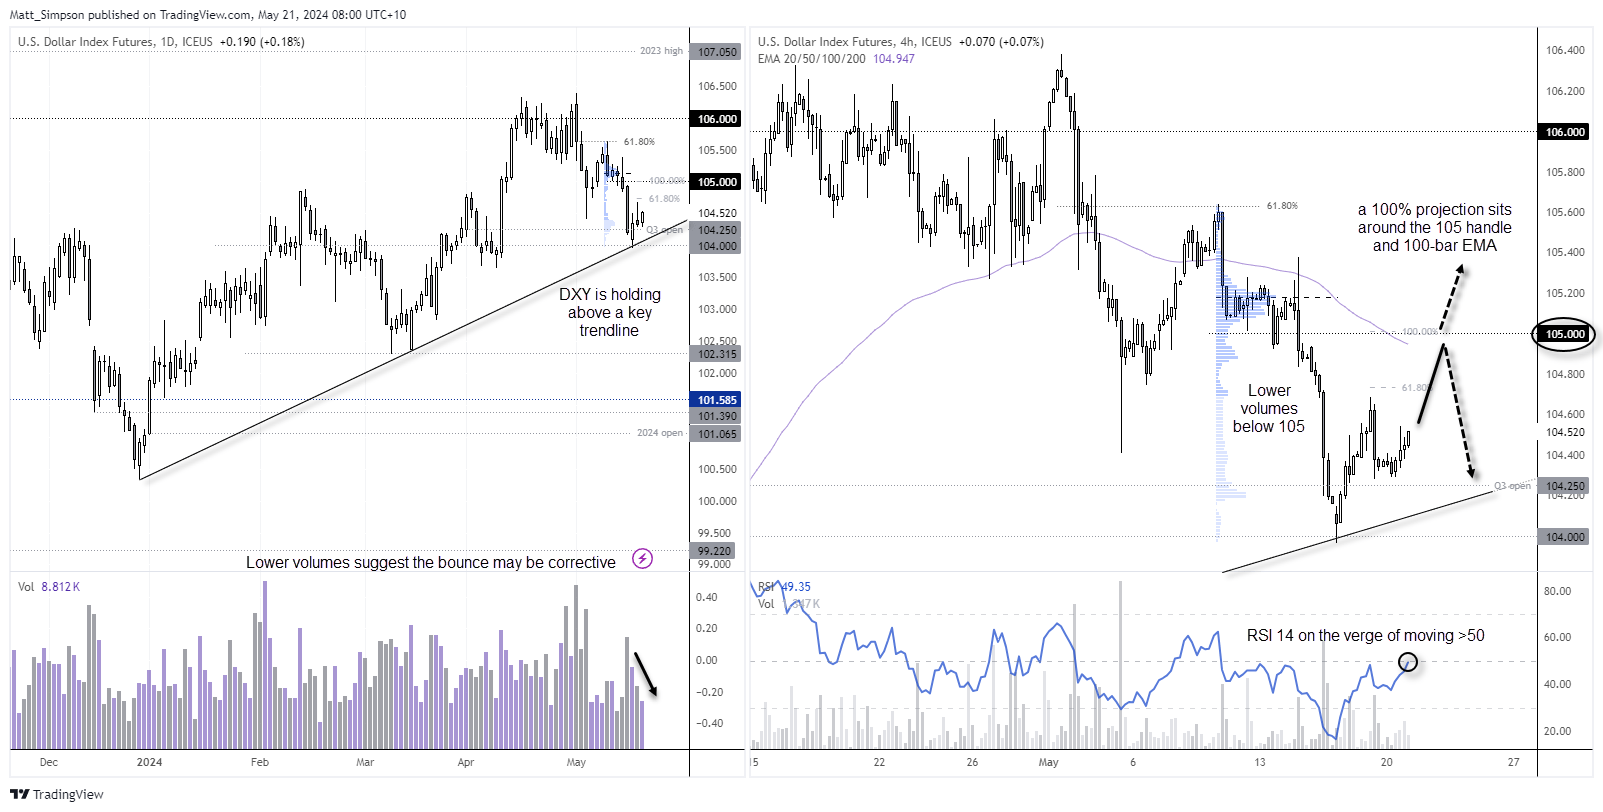
In yesterday’s COT report I noted that large speculators were net-long USD index futures for a second week, and that asset managers remained predominantly net-long despite a slight reduction of bullish exposure during the dollar's retracement lower. This also comes at a time when the US dollar index is trying to hold above the key bullish trendline from the December low.
USD prices were allowed to drift higher during quiet trade on Monday. And as the 4-hour chart shows, volumes were relatively thin during the fall from 105 down to 104. Therefore, the current drift higher may simply be the market trying to head for the high-volume node around 105.20. However, 105 may make a more sensible interim bullish target due to its round-number statues, which is also near a 100% projection ratio and the 100-bar EMA.
View the full economic calendar
View the full economic calendar
-- Written by Matt Simpson
Follow Matt on Twitter @cLeverEdge
How to trade with City Index
You can trade with City Index by following these four easy steps:
- Open an account, or log in if you’re already a customer
• Open an account in the UK
• Open an account in Australia
• Open an account in Singapore
- Search for the market you want to trade in our award-winning platform
- Choose your position and size, and your stop and limit levels
- Place the trade
Related tags:


Open an account in minutes
Experience award-winning platforms with fast and secure execution, and enjoy tight spreads from 0.5 pts on FX and 0.3 pts on indices.
Economic calendar
Web Trader platform
Our sophisticated web-based platform is packed with features.
Related articles
USD/JPY weekly outlook: Quarter turn scrambles rates regime
USD/JPY’s tight relationship with front-end US rates broke down sharply last week, but quarter-turn flows and positioning suggest the disconnect may prove temporary.

USD/CAD forecast: rally could accelerate above June highs at 1.4250
USD/CAD recovered quickly after weaker US jobs data, keeping the bullish trend in focus. A move above the June highs could accelerate the rally as inflation keeps the Fed under pressure.


USD Sets Fresh Yearly High as EUR/USD Drops Dramatically, USD/JPY Stable
Well, it was a week of USD strength that wasn’t entirely pushed by USD/JPY, as a strong sell-off in EUR/USD has pushed the major pair to its most oversold state in a decade.

This report is intended for general circulation only. It should not be construed as a recommendation, or an offer (or solicitation of an offer) to buy or sell any financial products. The information provided does not take into account your specific investment objectives, financial situation or particular needs. Before you act on any recommendation that may be contained in this report, independent advice ought to be sought from a financial adviser regarding the suitability of the investment product, taking into account your specific investment objectives, financial situation or particular needs.
StoneX Financial Pte. Ltd., may distribute reports produced by its respective foreign entities or affiliates within the StoneX group of companies or third parties pursuant to an arrangement under Regulation 32C of the Financial Advisers Regulations. Where the report is distributed to a person in Singapore who is not an accredited investor, expert investor or an institutional investor (as defined in the Securities Futures Act), StoneX Financial Pte. Ltd. accepts legal responsibility to such persons for the contents of the report only to the extent required by law. Singapore recipients should contact StoneX Financial Pte. Ltd. at 6826 9988 for matters arising from, or in connection with the report.
In the case of all other recipients of this report, to the extent permitted by applicable laws and regulations neither StoneX Financial Pte. Ltd. nor its associated companies will be responsible or liable for any loss or damage incurred arising out of, or in connection with, any use of the information contained in this report and all such liability is hereby expressly disclaimed. No representation or warranty is made, express or implied, that the content of this report is complete or accurate.
StoneX Financial Pte. Ltd. is not under any obligation to update this report.
Trading CFDs carries a high level of risk that may not be suitable for some investors. Consider your investment objectives, level of experience, financial resources, risk appetite and other relevant circumstances carefully. The possibility exists that you could lose some or all of your investments, including your initial deposits. If in doubt, please seek independent expert advice. Visit www.forex.com/en-sg/terms-and-policies for the complete Risk Disclosure Statement.