



Gold Price Forecast: Gold Tests Key Resistance as Hormuz Tensions Rise, US Dollar (DXY) Pressured Below 99
Gold price (XAU/USD) is testing key resistance near the 4800 zone as Hormuz tensions re-escalate, while the US Dollar Index (DXY) trades below 99. Markets are heading into a key volatility window with upcoming US data, including NFP and CPI, likely to drive the next major move.
Share this:

Weekly Recap: Gold, US Dollar, and Indices
- Gold and silver staged bullish rebounds, returning near key resistance levels at 4800 and 84, respectively. Metals are now testing the bounds of the February–May decline.
- US indices, Nasdaq and the S&P 500, are exhausting fresh record highs near 29,000 and 7,400, ahead of key US data releases, NFP today, CPI next week.
- The US Dollar Index (DXY) remains pressured below the 99 zone, weighed by declining haven demand and renewed BOJ intervention risks, while testing the sustainability of the 2008–2026 structure.
- Softer US bond yields, now pressured below their March and May 2026 highs, are supporting short term bullish momentum in equities and metals while adding downside pressure on the US dollar.
These moves come as US–Iran peace proposals remain misaligned, prompting renewed escalation in the Hormuz Strait and across the region. As a result, both geopolitical developments and technical structures are driving potential breakout and reversal scenarios across markets.
The ongoing misalignment in this peace process is weighing on global markets through slower growth expectations, rising inflation pressures, and increased price volatility. Rapidly shifting headlines continue to trigger chart whipsaws, leaving portfolios exposed to unstable market conditions.
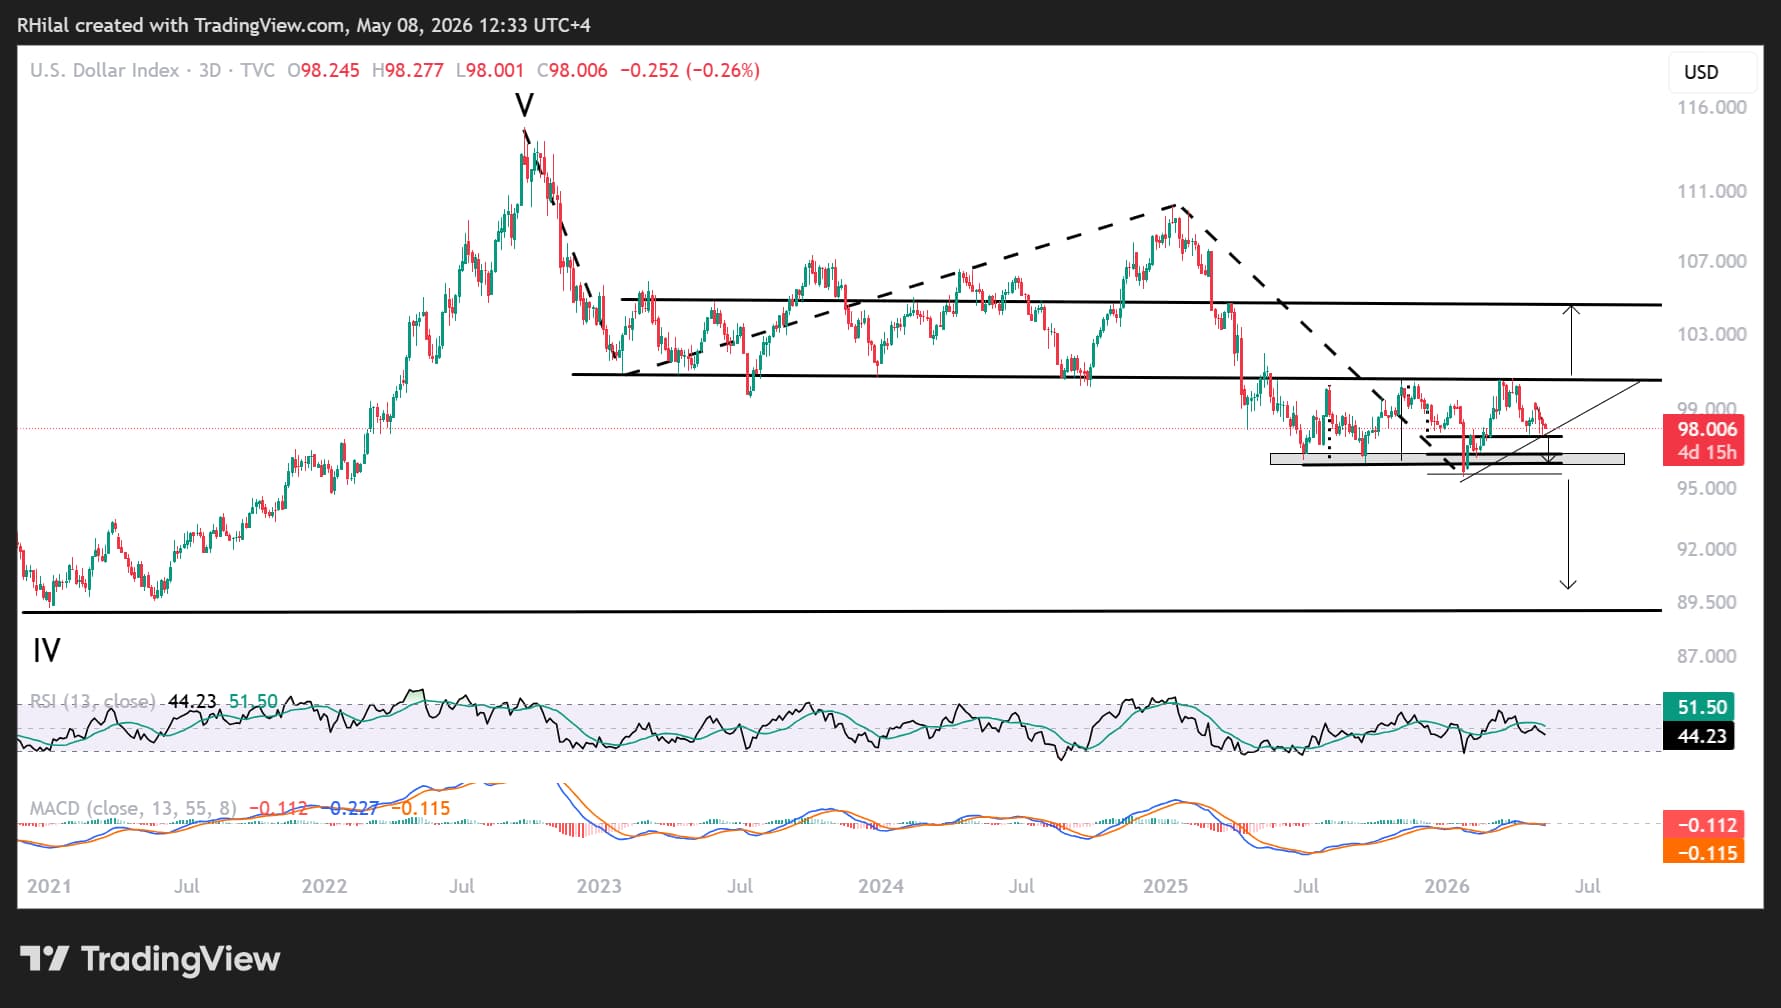
US Dollar Forecast (DXY): 3-Day Chart Analysis – Key Levels at 99 and 100.60
Source: TradingView
The 3-day timeframe highlights the US Dollar Index (DXY) trading within the June 2025 – May 2026 consolidation range, positioned below the broader January 2023 – April 2025 range, capped near the 100.60 level.
A bullish DXY scenario would be confirmed with a break above 99.50 in the near term and 100.60 in the medium term, opening the path toward 104.40, which could pressure global currencies and gold prices.
A bearish breakout below 97 would expose downside toward 95 in the short term—a key level supporting price action above the long-term 2008–2026 uptrend. A sustained breakdown could extend losses toward 2021 lows near 89, supporting further upside in XAU/USD and global currencies.
As Hormuz-related headlines evolve, the technical structure remains critical in confirming direction for the US Dollar.
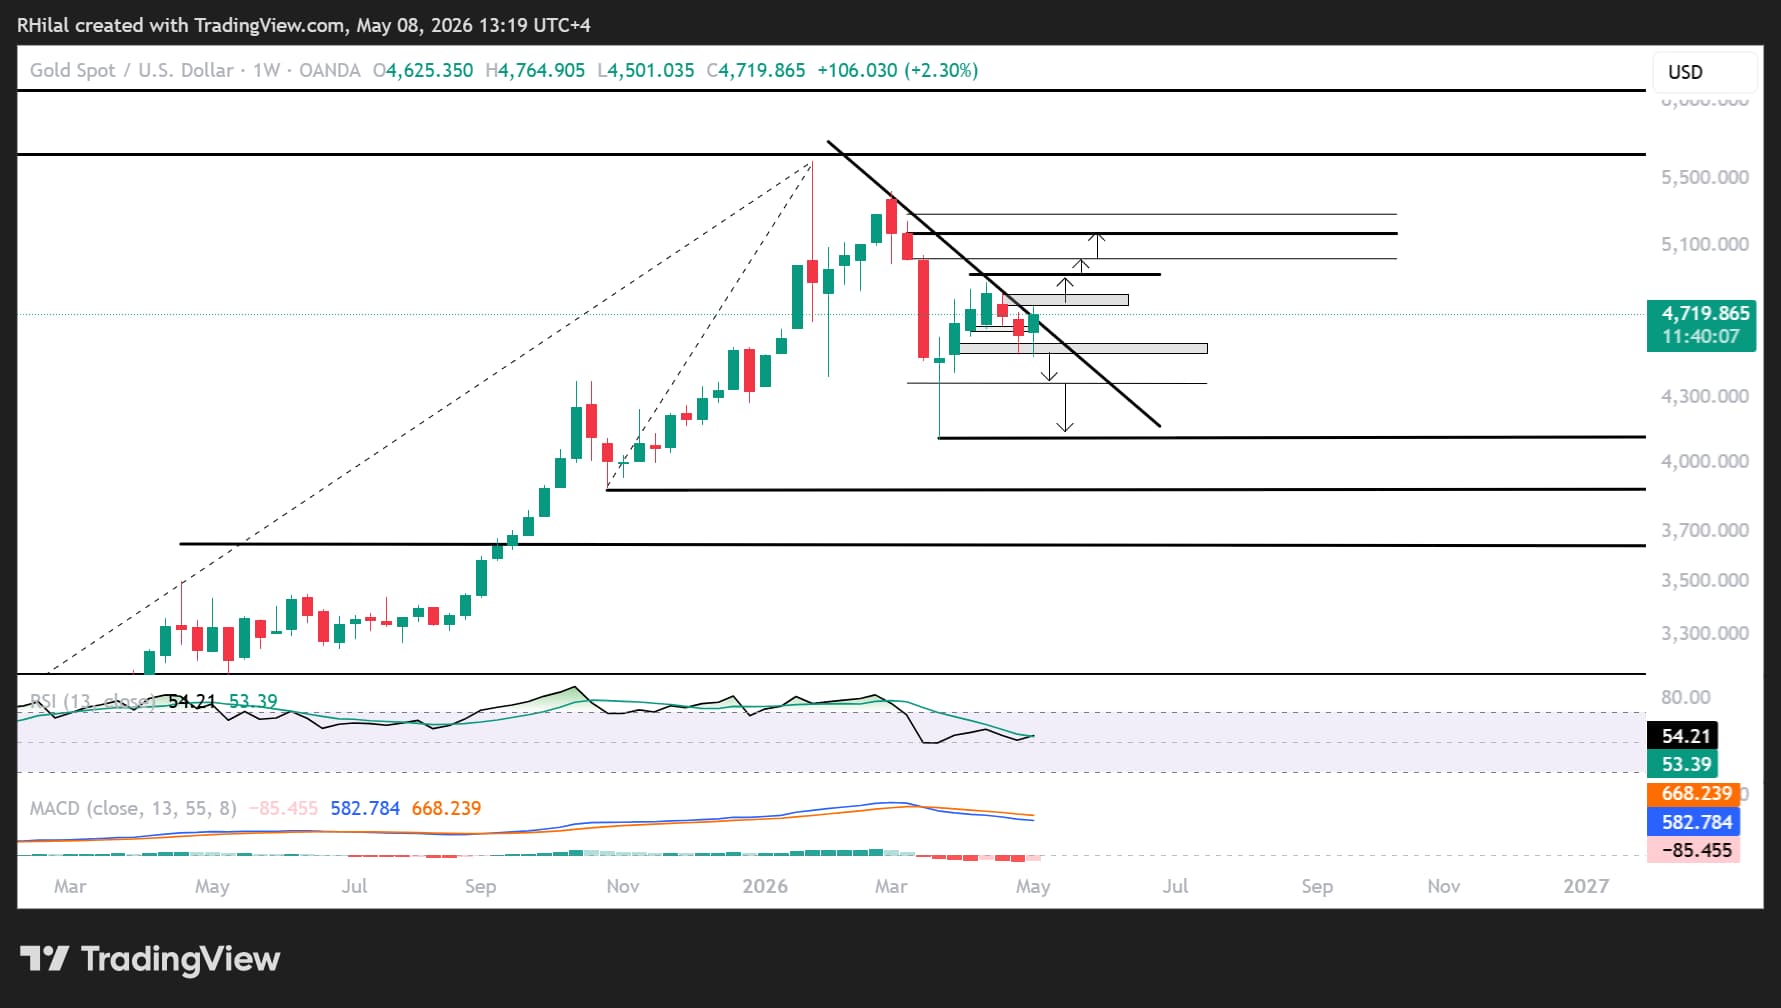
Gold Price Forecast (XAU/USD): Weekly Chart – Testing Key Resistance at 4800
Source: TradingView
Gold (XAU/USD) is now testing a critical resistance zone near 4800, following its sharp pullback from yearly highs. This level aligns with a descending trendline connecting lower highs between February and April 2026, making it a key inflection point for price direction.
A bullish gold scenario emerges with sustained price action above 4830 and 4890, which could redirect momentum toward 5000, followed by resistance at 5250, before potentially extending toward the 6000 level.
A bearish scenario would be reinforced if gold rejects this resistance and closes below 4500 and 4300, opening the door for a move toward 4000, with further downside extending toward the 3800 zone—a level that may present long-term accumulation opportunities.
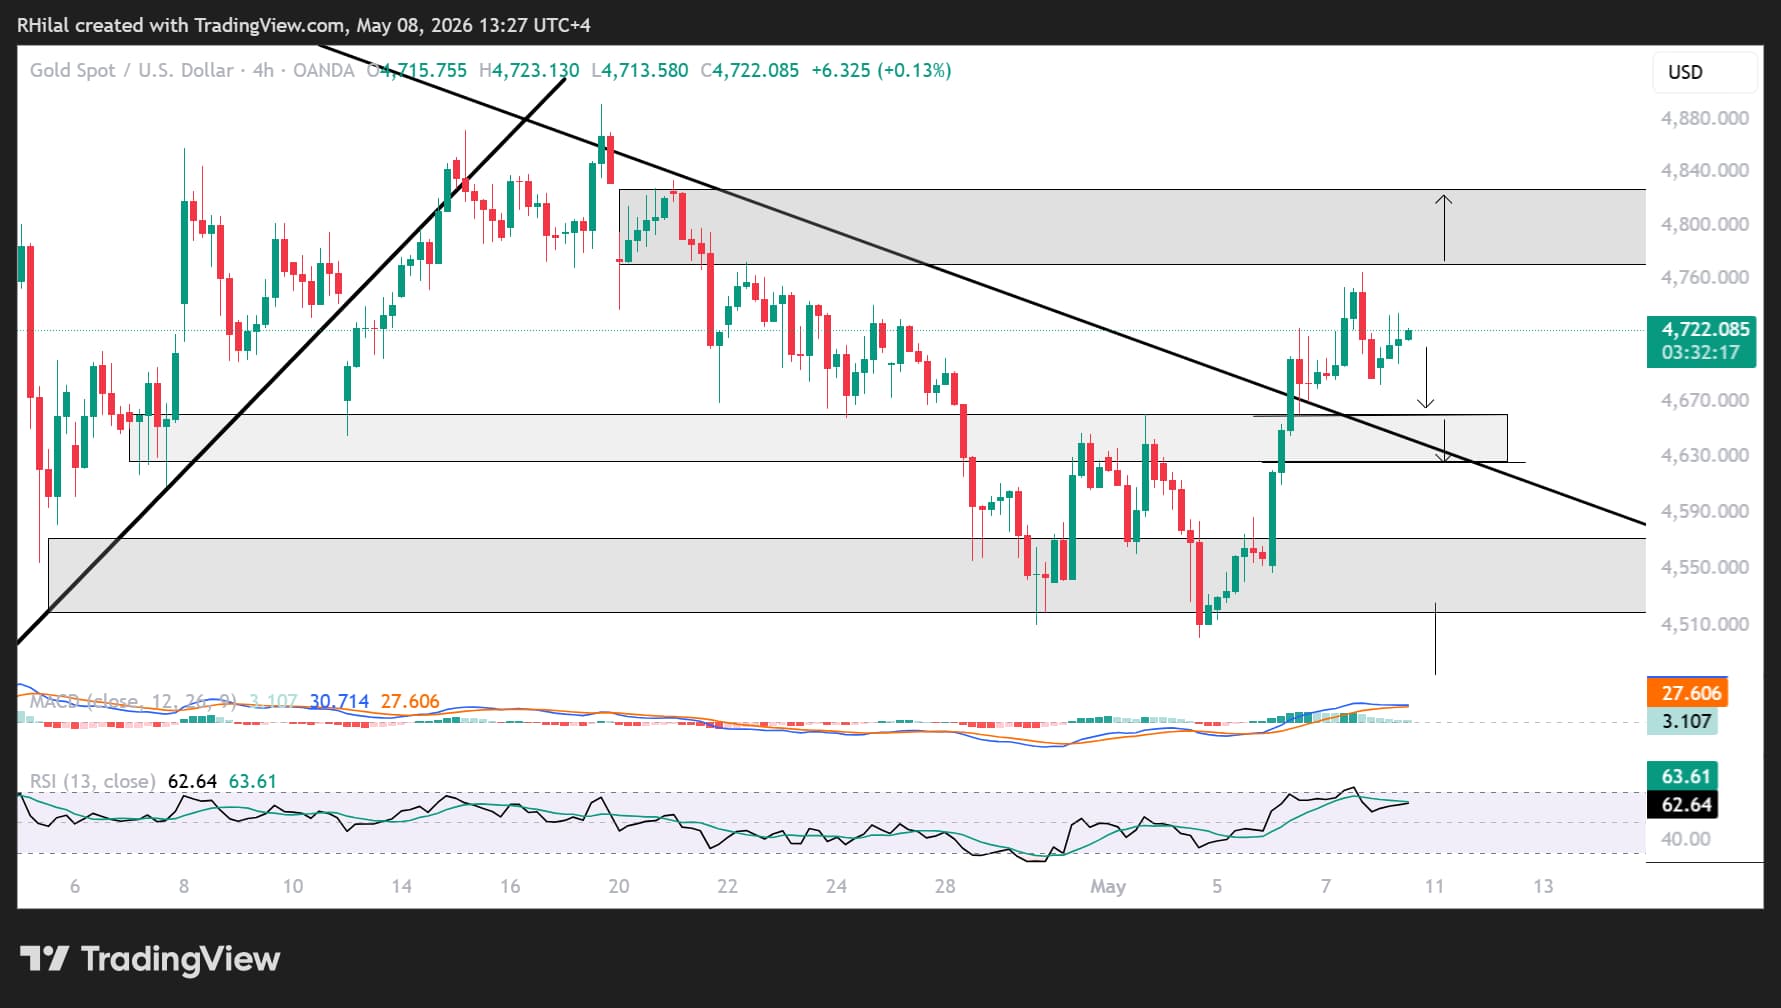
Gold Price Forecast (XAU/USD): 4-Hour Chart – Short-Term Pullback Risk
Source: TradingView
On the 4-hour timeframe, short-term pullbacks may develop as RSI and MACD show bearish divergence from overbought levels. This could drive a retest of the February–April trendline near 4660–4640, followed by a potential move toward the 4500 support level, reinforcing the short-term bearish bias.
On the upside, a sustained break above 4740 and 4760 would reopen a move toward the 4820–4890 resistance zone, potentially restoring the broader bullish outlook for gold price.
Written by Razan Hilal, CMT
Follow on X: @Rh_waves


Open an account in minutes
Experience award-winning platforms with fast and secure execution, and enjoy tight spreads from 0.5 pts on FX and 0.3 pts on indices.
Economic calendar
Web Trader platform
Our sophisticated web-based platform is packed with features.
Related articles
Gold Breaks Down on Descending Triangle, Sets Up $4k Test
Gold started last week with a strong sell-off but from that move a bounce developed. Bulls could not hold on through the weekly close, however, and the bearish structure remains in-place for XAU/USD.

USD/JPY weekly outlook: Quarter turn scrambles rates regime
USD/JPY’s tight relationship with front-end US rates broke down sharply last week, but quarter-turn flows and positioning suggest the disconnect may prove temporary.


Gold Update: XAU/USD Remains Under Pressure Even After the NFP Report
As the trading week comes to an end, weakness around gold price action remains evident in the short term. This can be seen in the performance of the past two sessions, where the metal has declined by approximately 0.3%. Although the move has not been particularly aggressive, it highlights that buying pressure continues to struggle to regain control of the market.

This report is intended for general circulation only. It should not be construed as a recommendation, or an offer (or solicitation of an offer) to buy or sell any financial products. The information provided does not take into account your specific investment objectives, financial situation or particular needs. Before you act on any recommendation that may be contained in this report, independent advice ought to be sought from a financial adviser regarding the suitability of the investment product, taking into account your specific investment objectives, financial situation or particular needs.
StoneX Financial Pte. Ltd., may distribute reports produced by its respective foreign entities or affiliates within the StoneX group of companies or third parties pursuant to an arrangement under Regulation 32C of the Financial Advisers Regulations. Where the report is distributed to a person in Singapore who is not an accredited investor, expert investor or an institutional investor (as defined in the Securities Futures Act), StoneX Financial Pte. Ltd. accepts legal responsibility to such persons for the contents of the report only to the extent required by law. Singapore recipients should contact StoneX Financial Pte. Ltd. at 6826 9988 for matters arising from, or in connection with the report.
In the case of all other recipients of this report, to the extent permitted by applicable laws and regulations neither StoneX Financial Pte. Ltd. nor its associated companies will be responsible or liable for any loss or damage incurred arising out of, or in connection with, any use of the information contained in this report and all such liability is hereby expressly disclaimed. No representation or warranty is made, express or implied, that the content of this report is complete or accurate.
StoneX Financial Pte. Ltd. is not under any obligation to update this report.
Trading CFDs carries a high level of risk that may not be suitable for some investors. Consider your investment objectives, level of experience, financial resources, risk appetite and other relevant circumstances carefully. The possibility exists that you could lose some or all of your investments, including your initial deposits. If in doubt, please seek independent expert advice. Visit www.forex.com/en-sg/terms-and-policies for the complete Risk Disclosure Statement.