





Gold Price Forecast: Has Gold Topped?
Gold has now put in two consecutive red bars on the weekly and that’s been rare as there’s only been two other occurrences of such in the past seven months. But it’s still too early to say that the metal has topped.
Share this:

Gold Talking Points:
- There have been two large down days for spot gold over the past couple of weeks, and that’s built a shorter-term series of lower-lows and lower-highs.
- To answer the question in the headline of this article, it’s still too early to say that gold has topped, and bulls showed another strong response to support at $2650 in late-week trade. But – next week’s price action will be key for that scenario. If sellers can push another lower-low while defending lower-highs, bearish themes in gold can take on more attraction and that could lead-in to deeper pullback scenarios.
- Behind the push for next week will likely be US inflation data due for release on Wednesday and Thursday. And one of those large sell-offs mentioned above showed on the heels of Core PCE coming in above expectation.
Gold bulls have put in a massive lift so far this year, with the bullish trend expanding as much as 40% from the February low up to the high two weeks ago. Along the way, RSI went overbought on both the monthly and weekly charts and at this point, we’ve seen gold strength persist through both times of USD-weakness and USD-strength. Clearly, something major was behind the trend and that likely revolves around the Fed’s continued dovish stance, even in light of strong economic data.
Last week was the second consecutive red weekly bar in gold and that’s something that hadn’t happened since early-August. And in that prior episode, the sell-off was slight as each of those bars took on an indecisive nature. For legitimate pullbacks with two or more consecutive weeks of losses we have to go all the way back to May when, at the time, gold was trying to gain acceptance above the $2300 level.
Gold Weekly Chart
 Chart prepared by James Stanley; data derived from Tradingview
Gold: It’s Still Overbought
From both the weekly and monthly charts of gold, it’s still overbought via RSI. And that’s been a recurring theme through this year and this highlights the downside of oscillators, in general. They can show context, but they’re not great for timing. Largely because a market continue to get even more overbought and that’s somewhat of the backdrop from the gold monthly chart, where overbought readings began to show in April when the metal was still working on the $2300 level.
But, with that said, it’s also opened the door to pullback potential and that’s been an active theme for the past couple of months.
The week of the FOMC rate cut gold tested $2600 for the first time ever and quickly pulled back. But – support then played around the $2550 level and a breakout followed. Then in late-September, gold stalled before a test of $2700 and, again, a pullback followed. This time, the $2600 level was defended in early-October around the release of US CPI. That again led to another bullish breakout and fresher all-time-highs.
Last week, it was the $2650 level that came into play to help hold the lows on both Wednesday and Thursday. That similarly led to a bounce and another test above $2700.
So, while there has been the pullback that likely is sourced from profit taking, there’s also been continued defense of the trend from bulls at big figures. And this suggests that buyers are not yet done.
Gold Daily Chart
 Chart prepared by James Stanley; data derived from Tradingview
Gold: The Counter-Scenario
When asking a question as bold as ‘is the top in,’ it’s at least worth investigating what it would take to bring this to fruition. And to be clear, this doesn’t necessarily suggest bearish reversals are on the radar as first, bears would need to chew through pre-existing support structure to give that more life.
Shorter-term charts will generally be a bit noisier, but they can also give an early look at what might happen next.
And from the four-hour chart, a claim can be made that gold set a lower-low after holding at a lower-high at $2750, which traded late on Tuesday before election results started to come in.
For bears to take greater control, they’ll need to hold price below that level next week. Going even shorter-term, there was a hold on Friday morning of resistance at prior support, right around the $2708 level. But the reaction from that has since held a possible higher-low at the same $2685 level that was resistance in late-September. So, even that has some asterisks next to it.
But, for bears to take control the need to hold highs below $2750. The prior support at $2725 is still of interest and this can be used in a couple different ways. If the $2685 support holds and leads to a bounce up to $2725, then there’s a shorter-term manifestation of higher-highs and lows and that opens the door for support at $2708 or $2700. That would then set the stage for another test of $2725 or above. If bulls fail to then drive above $2750, then we’d have an element of failure that would show from the daily chart and that’s something that could speak to larger pullback or possibly even reversal scenarios.
If that scenario does play out, the next support to follow is down around $2600, with the $2602.71 level that held support after the CPI report in October sticking out.
Gold Four-Hour Chart
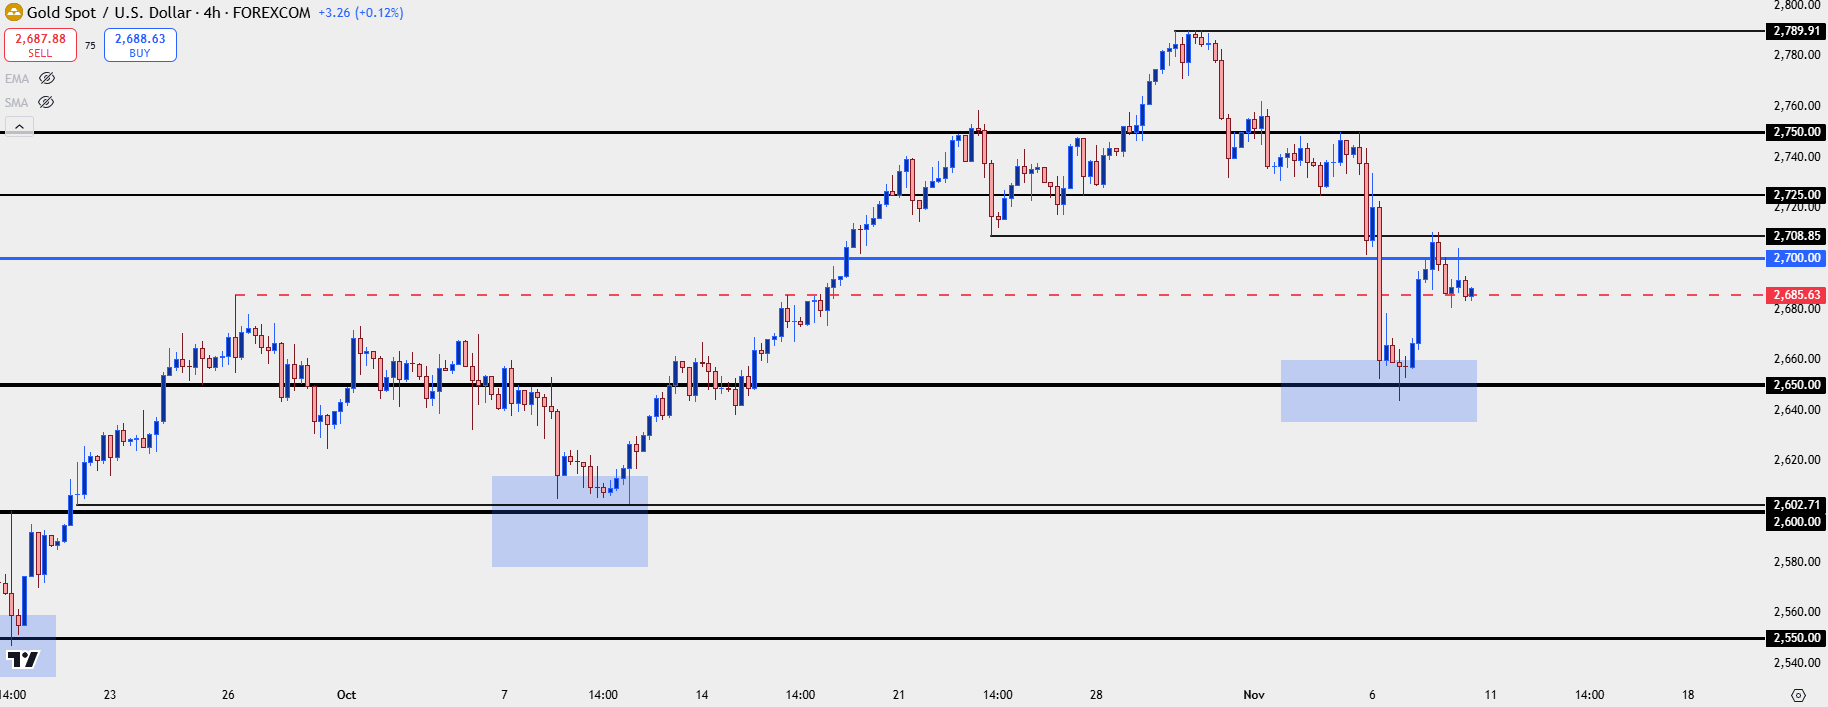 Chart prepared by James Stanley; data derived from Tradingview
--- written by James Stanley, Senior Strategist
Gold Talking Points:
- There have been two large down days for spot gold over the past couple of weeks, and that’s built a shorter-term series of lower-lows and lower-highs.
- To answer the question in the headline of this article, it’s still too early to say that gold has topped, and bulls showed another strong response to support at $2650 in late-week trade. But – next week’s price action will be key for that scenario. If sellers can push another lower-low while defending lower-highs, bearish themes in gold can take on more attraction and that could lead-in to deeper pullback scenarios.
- Behind the push for next week will likely be US inflation data due for release on Wednesday and Thursday. And one of those large sell-offs mentioned above showed on the heels of Core PCE coming in above expectation.
Gold bulls have put in a massive lift so far this year, with the bullish trend expanding as much as 40% from the February low up to the high two weeks ago. Along the way, RSI went overbought on both the monthly and weekly charts and at this point, we’ve seen gold strength persist through both times of USD-weakness and USD-strength. Clearly, something major was behind the trend and that likely revolves around the Fed’s continued dovish stance, even in light of strong economic data.
Last week was the second consecutive red weekly bar in gold and that’s something that hadn’t happened since early-August. And in that prior episode, the sell-off was slight as each of those bars took on an indecisive nature. For legitimate pullbacks with two or more consecutive weeks of losses we have to go all the way back to May when, at the time, gold was trying to gain acceptance above the $2300 level.
Gold Weekly Chart
Chart prepared by James Stanley; data derived from Tradingview
Gold: It’s Still Overbought
From both the weekly and monthly charts of gold, it’s still overbought via RSI. And that’s been a recurring theme through this year and this highlights the downside of oscillators, in general. They can show context, but they’re not great for timing. Largely because a market continue to get even more overbought and that’s somewhat of the backdrop from the gold monthly chart, where overbought readings began to show in April when the metal was still working on the $2300 level.
But, with that said, it’s also opened the door to pullback potential and that’s been an active theme for the past couple of months.
The week of the FOMC rate cut gold tested $2600 for the first time ever and quickly pulled back. But – support then played around the $2550 level and a breakout followed. Then in late-September, gold stalled before a test of $2700 and, again, a pullback followed. This time, the $2600 level was defended in early-October around the release of US CPI. That again led to another bullish breakout and fresher all-time-highs.
Last week, it was the $2650 level that came into play to help hold the lows on both Wednesday and Thursday. That similarly led to a bounce and another test above $2700.
So, while there has been the pullback that likely is sourced from profit taking, there’s also been continued defense of the trend from bulls at big figures. And this suggests that buyers are not yet done.
Gold Daily Chart
Chart prepared by James Stanley; data derived from Tradingview
Gold: The Counter-Scenario
When asking a question as bold as ‘is the top in,’ it’s at least worth investigating what it would take to bring this to fruition. And to be clear, this doesn’t necessarily suggest bearish reversals are on the radar as first, bears would need to chew through pre-existing support structure to give that more life.
Shorter-term charts will generally be a bit noisier, but they can also give an early look at what might happen next.
And from the four-hour chart, a claim can be made that gold set a lower-low after holding at a lower-high at $2750, which traded late on Tuesday before election results started to come in.
For bears to take greater control, they’ll need to hold price below that level next week. Going even shorter-term, there was a hold on Friday morning of resistance at prior support, right around the $2708 level. But the reaction from that has since held a possible higher-low at the same $2685 level that was resistance in late-September. So, even that has some asterisks next to it.
But, for bears to take control the need to hold highs below $2750. The prior support at $2725 is still of interest and this can be used in a couple different ways. If the $2685 support holds and leads to a bounce up to $2725, then there’s a shorter-term manifestation of higher-highs and lows and that opens the door for support at $2708 or $2700. That would then set the stage for another test of $2725 or above. If bulls fail to then drive above $2750, then we’d have an element of failure that would show from the daily chart and that’s something that could speak to larger pullback or possibly even reversal scenarios.
If that scenario does play out, the next support to follow is down around $2600, with the $2602.71 level that held support after the CPI report in October sticking out.
Gold Four-Hour Chart
Chart prepared by James Stanley; data derived from Tradingview
--- written by James Stanley, Senior Strategist


Open an account in minutes
Experience award-winning platforms with fast and secure execution, and enjoy tight spreads from 0.5 pts on FX and 0.3 pts on indices.
Economic calendar
Web Trader platform
Our sophisticated web-based platform is packed with features.
Related articles
Gold forecast: Rising yields become too hot for gold, but the outlook is far from bearish
Gold and silver prices took a plunge today, with the former down 3% and the latter falling some 5% by mid European session, before bouncing off their lows. The losses come after the metals remained largely supported until last week, despite the big dollar rally and surging bond yields as we have seen in recent weeks. But it simply got too much, and the metals succumbed to pressure today.

USD into a Massive Week as Yields Fly and Gold Breaks
It’s a huge week with PCE and NFP, but it’s what’s happening off of the calendar that demands attention with US yields flying to fresh multi-decade highs.

AUD/USD forecast: Currency Pair of the Week | September 28, 2026
The week has started with stocks, gold, silver and bitcoin all falling, as crude oil rebounded and bond yields pushed further higher. Trump refusing to agree to Tehran’s proposal to re-open the Strait of Hormuz has left the markets disappointed. Still, reports that mediators are expected to hold talks with the two sides on an amended version of the 7-day proposal that Iran presented, keeps hopes alive that we may see some progress.
This report is intended for general circulation only. It should not be construed as a recommendation, or an offer (or solicitation of an offer) to buy or sell any financial products. The information provided does not take into account your specific investment objectives, financial situation or particular needs. Before you act on any recommendation that may be contained in this report, independent advice ought to be sought from a financial adviser regarding the suitability of the investment product, taking into account your specific investment objectives, financial situation or particular needs.
StoneX Financial Pte. Ltd., may distribute reports produced by its respective foreign entities or affiliates within the StoneX group of companies or third parties pursuant to an arrangement under Regulation 32C of the Financial Advisers Regulations. Where the report is distributed to a person in Singapore who is not an accredited investor, expert investor or an institutional investor (as defined in the Securities Futures Act), StoneX Financial Pte. Ltd. accepts legal responsibility to such persons for the contents of the report only to the extent required by law. Singapore recipients should contact StoneX Financial Pte. Ltd. at 6826 9988 for matters arising from, or in connection with the report.
In the case of all other recipients of this report, to the extent permitted by applicable laws and regulations neither StoneX Financial Pte. Ltd. nor its associated companies will be responsible or liable for any loss or damage incurred arising out of, or in connection with, any use of the information contained in this report and all such liability is hereby expressly disclaimed. No representation or warranty is made, express or implied, that the content of this report is complete or accurate.
StoneX Financial Pte. Ltd. is not under any obligation to update this report.
Trading CFDs carries a high level of risk that may not be suitable for some investors. Consider your investment objectives, level of experience, financial resources, risk appetite and other relevant circumstances carefully. The possibility exists that you could lose some or all of your investments, including your initial deposits. If in doubt, please seek independent expert advice. Visit www.forex.com/en-sg/terms-and-policies for the complete Risk Disclosure Statement.