







Gold Rebounds, Crude Oil Tests Support as Markets Eye Fed, Trade Talks
Gold rebounds from key support, crude oil stabilises near recent lows, and Wall Street eyes the Fed meeting and trade tensions amid sticky inflation signals.
Share this:

View related analysis:
- WTI Crude Oil Analysis: Bears Eye Another Assault on $60
- AUD/USD Weekly Outlook: Yuan Correlation Supports Aussie Strength
- Japanese Yen Bulls Still Pushing Their Luck: COT Report
View related analysis:
- WTI Crude Oil Analysis: Bears Eye Another Assault on $60
- AUD/USD Weekly Outlook: Yuan Correlation Supports Aussie Strength
- Japanese Yen Bulls Still Pushing Their Luck: COT Report
Wall Street Futures Pull Back Ahead of Fed Meeting
Wall Street futures closed lower on Monday during thin holiday trade, as investors booked profits ahead of this week’s Federal Reserve (Fed) meeting and adopted a cautious tone amid ongoing trade negotiations. The Nasdaq 100 (-0.69%), S&P 500 (-0.65%), and Dow Jones (-0.26%) all formed small bearish inside days, highlighting a reluctance to commit in either direction ahead of the FOMC meeting.


ISM Data Highlights Sticky Inflation Ahead of FOMC
ISM services expanded slightly faster in April, rising to 51.6 from 50.8. The internals were generally solid, with the main concern being the ‘prices paid’ component, which jumped to a 28-month high—signalling persistent inflationary pressure. Employment also contracted for a second consecutive month, though at a slower pace (-49 vs -46.2 previously). This followed last week’s ISM manufacturing report, which showed the sector contracting at its fastest pace in six months, with prices paid rising at their fastest rate in nearly three years and employment also stalling for a second month.
These inflationary pressures make it difficult for the Fed to adopt a dovish tone this week. Fed funds futures currently favour a rate cut in July, but it’s unlikely the Fed will tip its hand two months in advance—especially with trade negotiations still in progress.
Economic Events in Focus (AEST / GMT+10)
- Public holiday in Japan, South Korea
- 11:00 – New Zealand commodity price index (ANZ)
- 11:30 – Australian building approvals
- 11:45 – Chinese services PMI (Caixin)
- 15:45 – Swiss unemployment
- 17:35 – Swiss National Bank (SNB) Vice Chairman Schlegel Speaks
- 18:00 – EU HCOB Eurozone Composite PMI (Apr)
- 18:30 – UK S&P Global Composite PMI (Apr)
- 19:00 – EU PPI (MoM) (Mar)
- 22:30 – Canadian trade balance (Mar)
- 00:00 – Canadian Ivey PMI (Apr)
CI Gold Q2
Gold Futures (GC) Technical Analysis
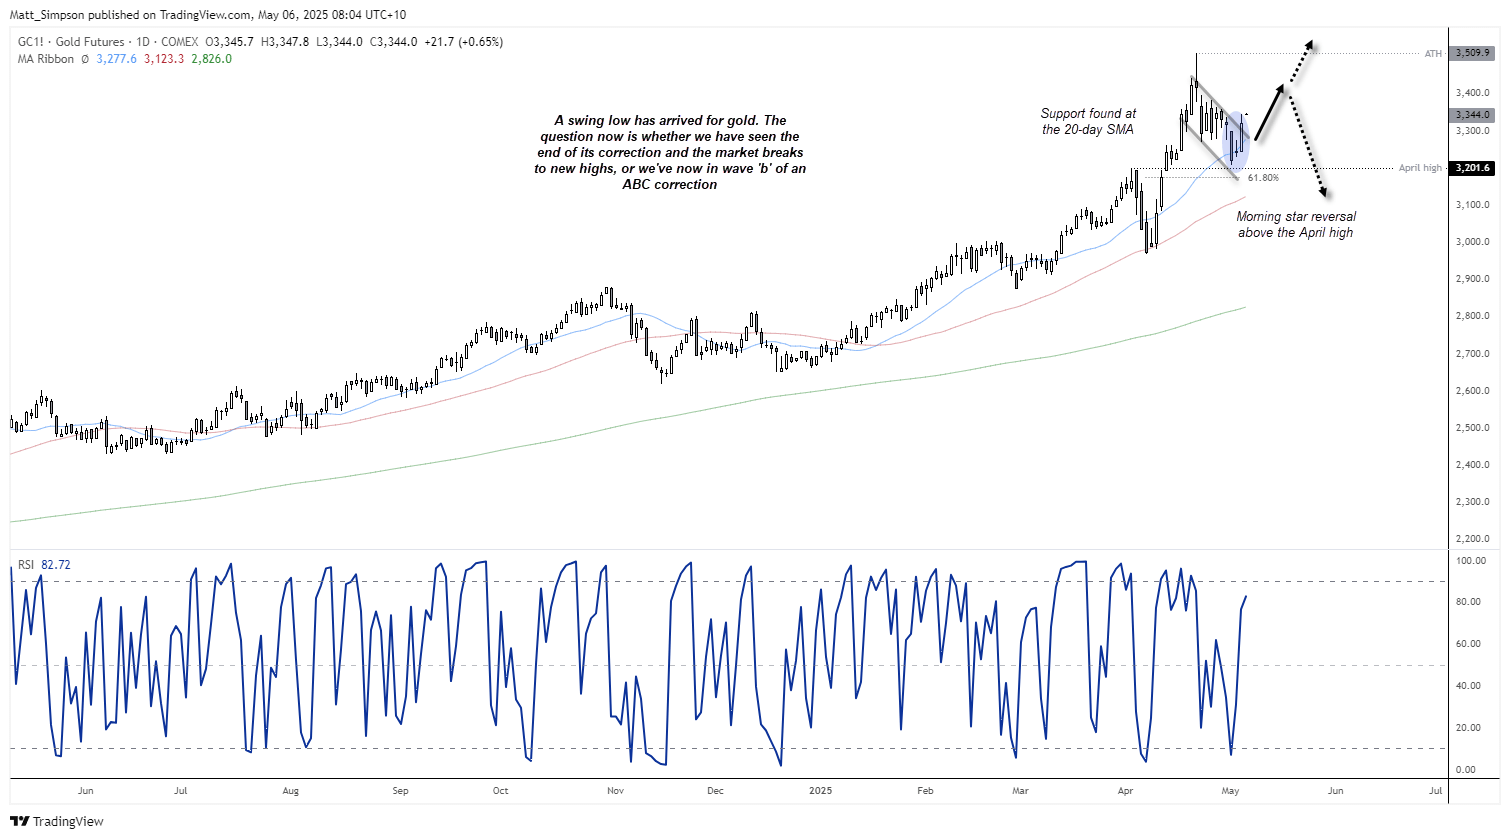
Gold snapped a four-day losing streak on Monday, delivering its best daily gain in two weeks at 2.4%. Friday’s inverted hammer candle — which was also an inside day — signalled hesitancy for the sell-off to continue or for prices to retest the April high. Support has since been found at the 20-day SMA, and momentum has realigned with the well-established bullish trend on the daily chart. Given gold had already fallen 8.5% from its record high in just seven days, a bounce almost feels overdue from a market that has repeatedly scalded bulls this year.
Traders will now watch closely to see if this rally can extend beyond short-covering and stabilise above key support and resistance levels.
WTI Crude Oil Futures (CL) Technical Analysis
Crude oil was back in the headlines over the weekend after OPEC+ announced another surprise output increase, catching markets off guard. My bearish bias on WTI crude, outlined on 23 April, played out well, with prices breaking below key support zones. However, the much-watched $60 area failed to provide meaningful support, and prices have now slipped toward the $57 handle.
That said, Monday’s daily candle resembles either a doji or hammer, both of which are potential reversal signals. This could mark the start of a bullish mean reversion, especially as price action becomes stretched and sentiment tilts heavily bearish.
And given that prices held above the April low and closed above the June 2023 low on Monday, alongside a bullish RSI (14) divergence, these are not levels that bears may want to linger around. Yes, fundamentals ultimately drive price, but if OPEC’s output increase was supposedly so bearish for oil, why is WTI crude still trading above recent swing lows?
This disconnect between narrative and price leads me to suspect a period of bullish mean reversion is due. Should that unfold, it could bring the December low at $59.31 and the $60 psychological handle back into focus — an area that also aligns with the split VPOC (Volume Point of Control) at 60.54.
-- Written by Matt Simpson
Follow Matt on Twitter @cLeverEdge
How to trade with City Index
You can trade with City Index by following these four easy steps:
- Open an account, or log in if you’re already a customer
• Open an account in the UK
• Open an account in Australia
• Open an account in Singapore
- Search for the market you want to trade in our award-winning platform
- Choose your position and size, and your stop and limit levels
- Place the trade
Related tags:


Open an account in minutes
Experience award-winning platforms with fast and secure execution, and enjoy tight spreads from 0.5 pts on FX and 0.3 pts on indices.
Economic calendar
Web Trader platform
Our sophisticated web-based platform is packed with features.
Related articles
Australian Dollar Outlook: AUD/USD Screams Sentiment Extreme Into Fed, CPI
AUD/USD rebounds despite record bearish futures positioning, with Australian Q3 CPI and the Fed meeting threatening to trigger another short squeeze.

EUR/USD weekly outlook: FOMC and ECB to set the tone
The current backdrop is modestly bearish. On Friday, the EUR/USD closed modestly lower, down for the third consecutive day. The pair also posted a weekly decline after staging a modest recovery attempt in the previous week. Out of the past 8 weeks, the EUR/USD has fallen on 6 occasions. There is not much supporting factors for the single currency right now. So, the upside remains capped.


Gold Does Something it Hasn’t Done in a Year, is Larger Risk-Off Afoot?
With tech stocks getting hit harder last week there was collateral damage elsewhere, including gold as the metal closed below the $4k level for the week and that’s the first time that’s happened to spot gold in more than a year.

This report is intended for general circulation only. It should not be construed as a recommendation, or an offer (or solicitation of an offer) to buy or sell any financial products. The information provided does not take into account your specific investment objectives, financial situation or particular needs. Before you act on any recommendation that may be contained in this report, independent advice ought to be sought from a financial adviser regarding the suitability of the investment product, taking into account your specific investment objectives, financial situation or particular needs.
StoneX Financial Pte. Ltd., may distribute reports produced by its respective foreign entities or affiliates within the StoneX group of companies or third parties pursuant to an arrangement under Regulation 32C of the Financial Advisers Regulations. Where the report is distributed to a person in Singapore who is not an accredited investor, expert investor or an institutional investor (as defined in the Securities Futures Act), StoneX Financial Pte. Ltd. accepts legal responsibility to such persons for the contents of the report only to the extent required by law. Singapore recipients should contact StoneX Financial Pte. Ltd. at 6826 9988 for matters arising from, or in connection with the report.
In the case of all other recipients of this report, to the extent permitted by applicable laws and regulations neither StoneX Financial Pte. Ltd. nor its associated companies will be responsible or liable for any loss or damage incurred arising out of, or in connection with, any use of the information contained in this report and all such liability is hereby expressly disclaimed. No representation or warranty is made, express or implied, that the content of this report is complete or accurate.
StoneX Financial Pte. Ltd. is not under any obligation to update this report.
Trading CFDs carries a high level of risk that may not be suitable for some investors. Consider your investment objectives, level of experience, financial resources, risk appetite and other relevant circumstances carefully. The possibility exists that you could lose some or all of your investments, including your initial deposits. If in doubt, please seek independent expert advice. Visit www.forex.com/en-sg/terms-and-policies for the complete Risk Disclosure Statement.