



Gold Update: Can XAU/USD Hold Above $4,500?
As trading comes to a close this week, one of the most relevant themes across financial markets continues to be the strength displayed by gold in the short term. Over the last three trading sessions, the precious metal has gained nearly 7%, highlighting the return of a meaningful bullish bias within the market.
Share this:

As trading comes to a close this week, one of the most relevant themes across financial markets continues to be the strength displayed by gold in the short term. Over the last three trading sessions, the precious metal has gained nearly 7%, highlighting the return of a meaningful bullish bias within the market. For now, one of the key factors supporting this move remains the recent weakness in the U.S. dollar, which has allowed gold to recover ground in a consistent manner. As long as this relationship remains in place, buying pressure could continue to play an important role during the upcoming trading sessions.

Is the U.S. dollar starting to lose its dominance?
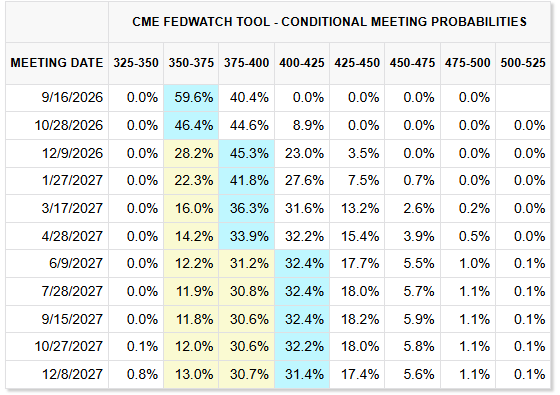
Several developments this week have continued to reinforce the view of a weaker U.S. dollar. One of them was the release of the Federal Reserve's meeting minutes. Although the document reiterated some concerns regarding inflation, it stopped short of confirming a fully aggressive policy stance for the months ahead. This interpretation continues to be reflected in market expectations for future Federal Reserve decisions, where probabilities currently remain around 60% and 46% that interest rates will remain unchanged at the meetings scheduled for September and October. As a result, the prospect of stable interest rates is regaining traction, a scenario that could be reducing part of the relative appeal of dollar-denominated investments.
Source: CMEGROUP
Another development that has not been particularly favorable for the U.S. currency was the recent announcement of Treasury buybacks focused on longer-dated bonds. Following the announcement, 30-year Treasury yields temporarily declined toward the 5.00% area. Although yields later recovered part of the lost ground, the dollar has not followed that rebound with the same intensity. This suggests that investors still do not view the increase in yields as a sufficient signal to fully restore confidence in the greenback. Together, a Federal Reserve that appears to be maintaining a wait-and-see approach and the recent developments in the bond market continue to limit the dollar's ability to regain strength in a sustained manner.
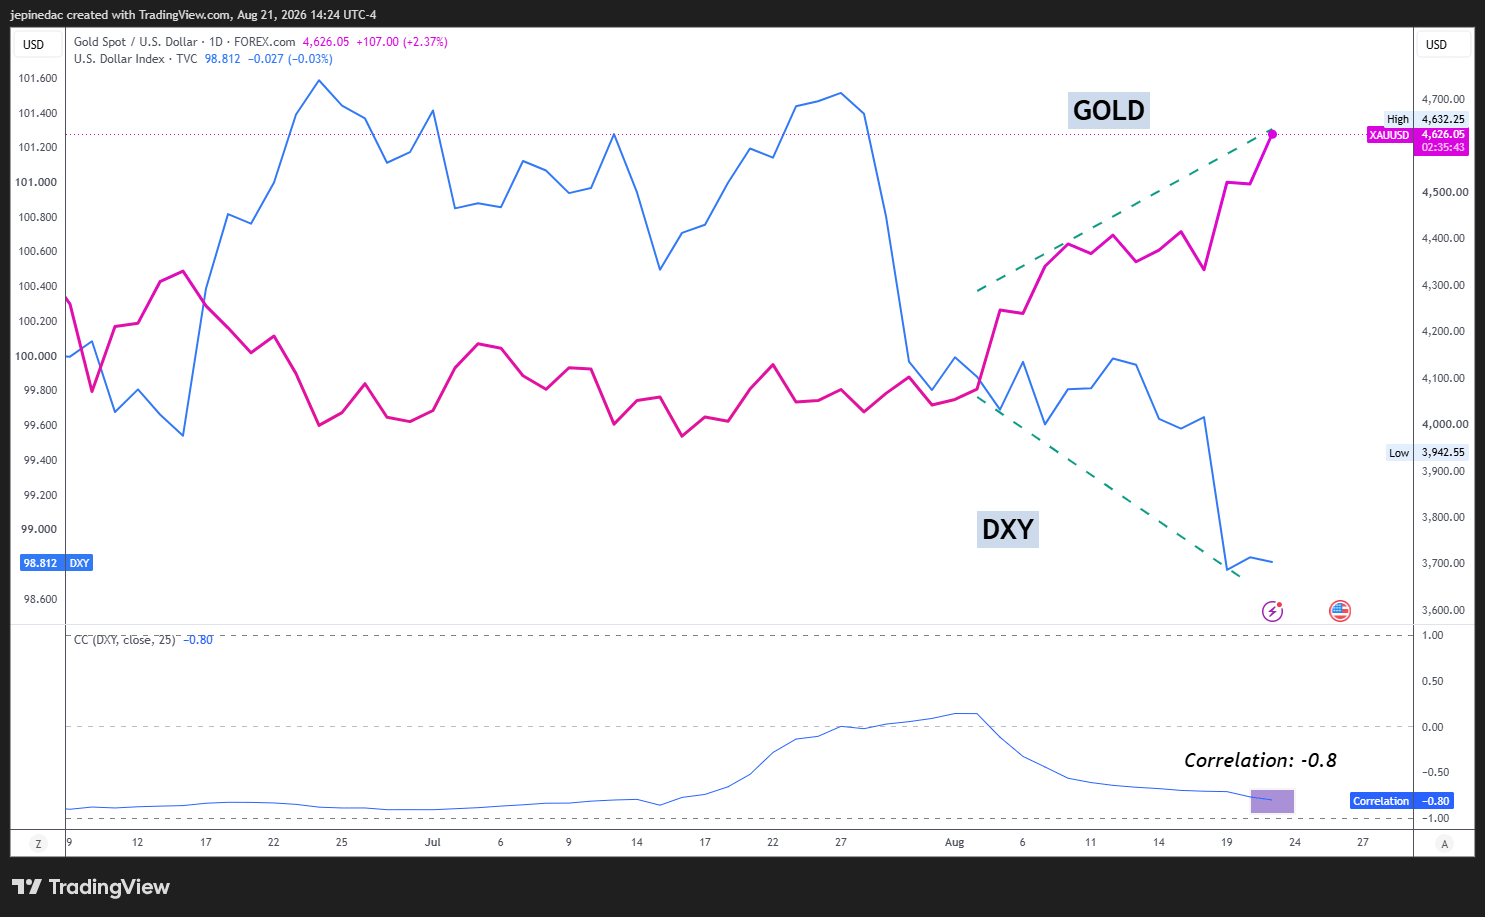
In fact, these developments have already begun to have a visible impact on the dollar's performance. The DXY Index, which measures the strength of the U.S. dollar against a basket of major currencies, continues to display a bearish profile and has now moved below the 99-point level. This reflects weaker demand for the U.S. currency in the short term.
Meanwhile, gold has shown almost the opposite behavior. Over recent sessions, the precious metal has managed to maintain a consistent recovery as the dollar has continued to lose ground. This relationship is also reflected in the correlation coefficient calculated over the last 25 trading sessions, which currently remains close to -0.8, highlighting a strong inverse relationship between both markets. It is important to remember that correlation coefficients can change over time.
Source: TVC, StoneX, Tradingview
Against this backdrop, the current dynamic is particularly interesting because broad-based weakness in the U.S. dollar appears to be allowing gold to regain prominence as an alternative asset in the short term. In addition, uncertainty is not limited to the dollar itself but also extends to the bond market, another key competitor to precious metals. Together, these factors have contributed to increased activity within the gold market.
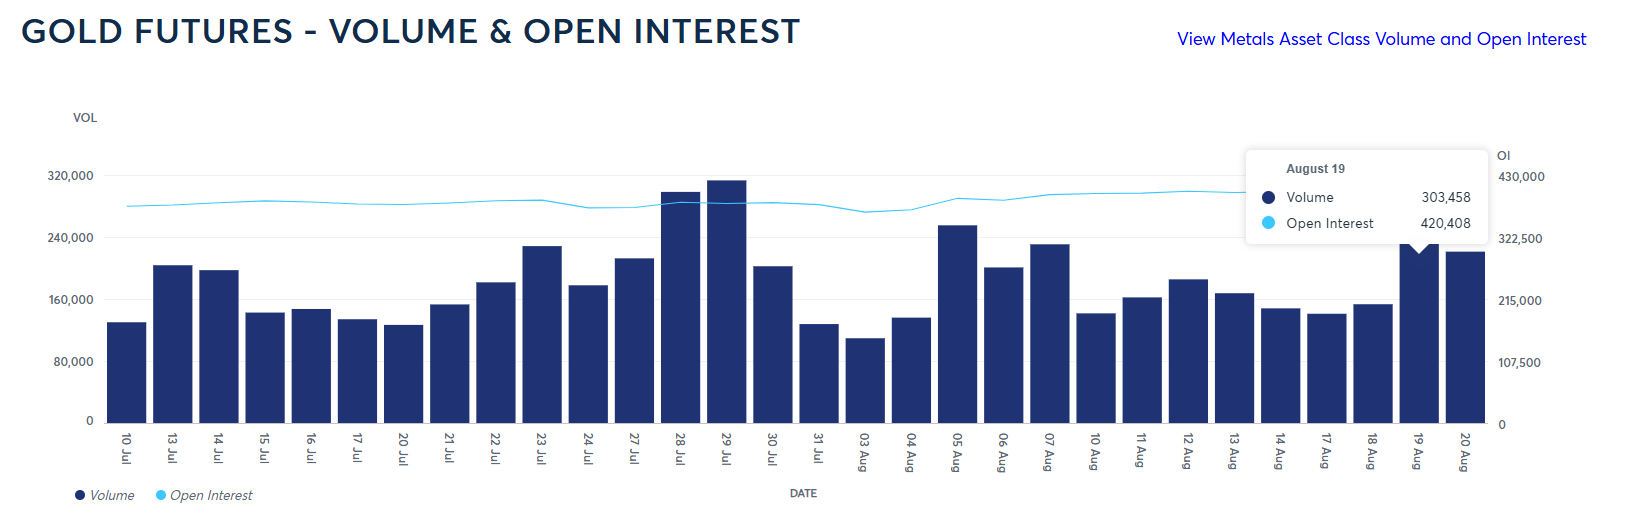
This trend can also be observed through futures market activity. During the week, trading volumes increased above the levels recorded the previous week, and on August 19 alone, the number of gold futures contracts traded exceeded 300,000 contracts. This not only reflects growing participation across the market but also coincides with the relative loss of appeal among substitute assets such as the U.S. dollar, a combination that may be supporting renewed interest in gold.
Source: CMEGROUP
Given this environment, gold may continue benefiting from the weakness observed in alternative markets such as the U.S. dollar. If this relationship remains consistent, buying pressure could continue to play an important role in the performance of XAU/USD during the upcoming trading sessions.
Gold Technical Outlook
Source: StoneX, Tradingview
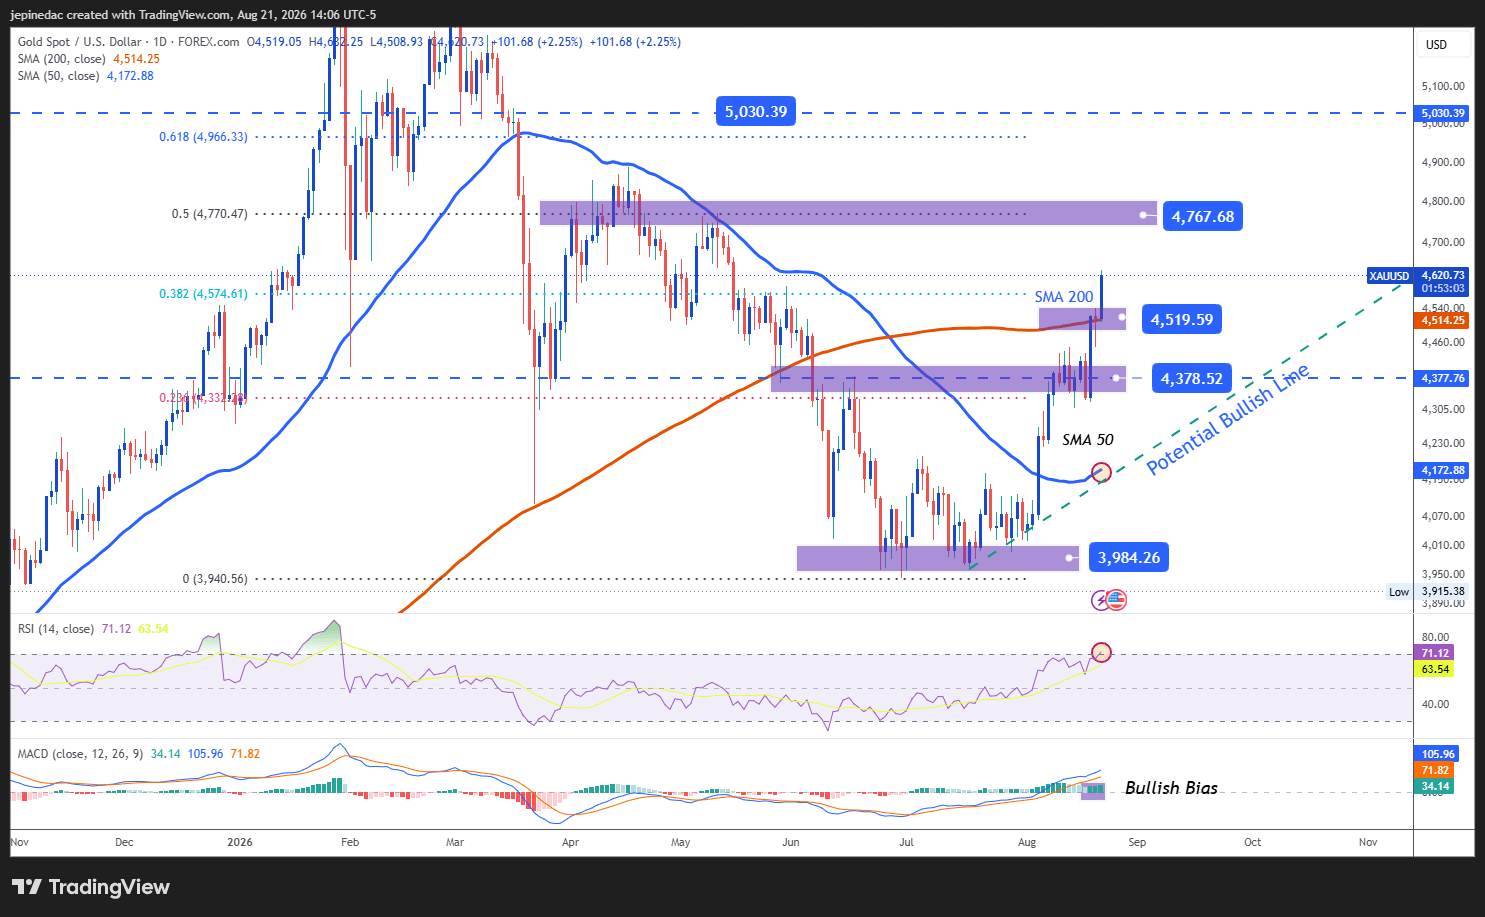
- A New Potential Trend Begins to Take Shape: Price action in recent sessions has started to form a possible short-term bullish trendline. The break above key technical levels, including both short- and long-term moving averages, is beginning to reinforce the significance of this pattern. If buying pressure stabilizes, this structure could gain greater relevance over the coming weeks. However, it is also important to consider that the speed of the recent rally has been considerable, which could leave room for temporary bearish corrections.
- MACD: The MACD histogram continues to post consistent readings above the neutral 0 line. This suggests that the strength of short-term moving averages remains supportive of a dominant bullish bias that could continue to be relevant in the weeks ahead.
- RSI: On the other hand, the RSI has already moved above the overbought threshold defined by the 70 level. This reading could be signaling an excessive buildup of buying momentum, which may eventually create room for short-term corrective pullbacks.
Key Levels to Watch:
- $4,700 – Critical Resistance: A major upside barrier that coincides with the 50% Fibonacci retracement level of the most relevant move on the chart and with highs not seen in several months. This level could become a significant obstacle for the continuation of the current bullish momentum over the coming weeks.
- $4,500 – Nearby Barrier: An important area that coincides with the 200-period moving average and represents one of the key technical levels to monitor should corrective downside movements begin to develop in the near term.
- $4,378 – Critical Support: This level corresponds to an important equilibrium zone observed several weeks ago and represents one of the most significant downside barriers on the chart. Price action that returns toward this area could weaken the credibility of the recent recovery and reintroduce a more pronounced sense of indecision into the market. It could even open the door to the formation of a broader consolidation range in the weeks ahead.
Written by Julian Pineda, CFA, CMT – Market Analyst
Follow him on: @julianpineda25
Latest market news



Open an account in minutes
Experience award-winning platforms with fast and secure execution, and enjoy tight spreads from 0.5 pts on FX and 0.3 pts on indices.
Economic calendar
Web Trader platform
Our sophisticated web-based platform is packed with features.
Related articles
US Dollar Price Action Setups: EUR/USD, GBP/USD, USD/JPY, USD/CAD
The US Dollar finished last week with a bearish engulf following a four-week winning streak. But the big question now is whether the Euro can pose any form of a recovery.

Gold Update: XAU/USD Remains Directionless Despite Falling Yields
As the trading week continues to unfold, the lack of direction dominating gold price action remains a relevant theme in the short term. In fact, the average move over the last three trading sessions has resulted in a decline of barely 1.0%, highlighting that neither buyers nor sellers have been able to take control in a consistent manner.

Crude Oil Analysis: WTI Approaches $100 Amid Growing Supply Risks
Recent trading sessions continue to highlight a strong bullish bias across the oil market. As reflected in the performance of WTI crude, prices have maintained a solid recovery since the beginning of October and are now up more than 12% since October 8, a development that continues to underline the strength of demand in the short term.
This report is intended for general circulation only. It should not be construed as a recommendation, or an offer (or solicitation of an offer) to buy or sell any financial products. The information provided does not take into account your specific investment objectives, financial situation or particular needs. Before you act on any recommendation that may be contained in this report, independent advice ought to be sought from a financial adviser regarding the suitability of the investment product, taking into account your specific investment objectives, financial situation or particular needs.
StoneX Financial Pte. Ltd., may distribute reports produced by its respective foreign entities or affiliates within the StoneX group of companies or third parties pursuant to an arrangement under Regulation 32C of the Financial Advisers Regulations. Where the report is distributed to a person in Singapore who is not an accredited investor, expert investor or an institutional investor (as defined in the Securities Futures Act), StoneX Financial Pte. Ltd. accepts legal responsibility to such persons for the contents of the report only to the extent required by law. Singapore recipients should contact StoneX Financial Pte. Ltd. at 6826 9988 for matters arising from, or in connection with the report.
In the case of all other recipients of this report, to the extent permitted by applicable laws and regulations neither StoneX Financial Pte. Ltd. nor its associated companies will be responsible or liable for any loss or damage incurred arising out of, or in connection with, any use of the information contained in this report and all such liability is hereby expressly disclaimed. No representation or warranty is made, express or implied, that the content of this report is complete or accurate.
StoneX Financial Pte. Ltd. is not under any obligation to update this report.
Trading CFDs carries a high level of risk that may not be suitable for some investors. Consider your investment objectives, level of experience, financial resources, risk appetite and other relevant circumstances carefully. The possibility exists that you could lose some or all of your investments, including your initial deposits. If in doubt, please seek independent expert advice. Visit www.forex.com/en-sg/terms-and-policies for the complete Risk Disclosure Statement.