



Nasdaq 100 Analysis: Is it becoming harder to reach new highs?
With the new trading week underway, the Nasdaq 100 has managed to reach new highs. However, the session’s gain is barely above 0.5%, a moderate move compared with previous weeks, when the index posted advances of more than 1.00% in a single session.
Share this:

With the new trading week underway, the Nasdaq 100 has managed to reach new highs. However, the session’s gain is barely above 0.5%, a moderate move compared with previous weeks, when the index posted advances of more than 1.00% in a single session.
This behavior is starting to reflect a loss of strength in short-term bullish moves and raises doubts about whether consistent buying appetite for the index can continue. For now, mixed updates around the Middle East appear to be weighing on confidence and making it harder for clearer demand to stabilize in Nasdaq price action. If there are no positive developments in the negotiations, a phase of indecision could become more relevant over the coming sessions.


Is confusion around the Middle East still present?
The week began with renewed tensions around the Middle East conflict after reports of attacks on Iranian radar sites and drones. At first, this fueled risk concerns again, especially after reports suggested that Iran had once again decided to pause message exchanges with Washington.
However, shortly after, a new source of calm appeared, as President Trump mentioned that talks were still moving forward to some extent. This has created meaningful confusion in the market: while there has not been a major escalation in the conflict, there is also no clear diplomatic solution yet, as contradictory signals continue to emerge between new attacks and possible talks.
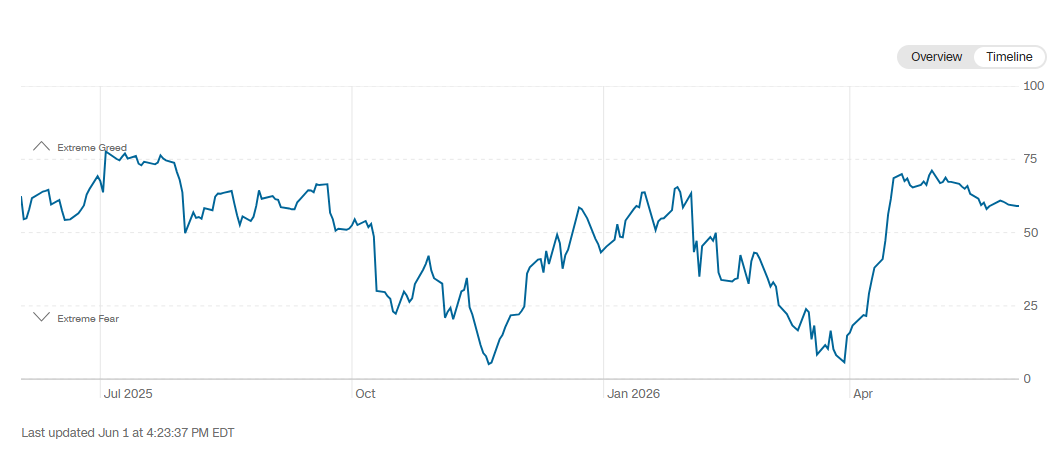
This uncertain environment has started to affect short-term confidence. This can be seen in the Fear and Greed Index, which remains near 59 points, still in “greed” territory. However, rather than showing a consistent improvement, the indicator’s curve has started to flatten, suggesting that there are no relevant changes in market confidence and that sentiment remains cautious.
Source: CNN
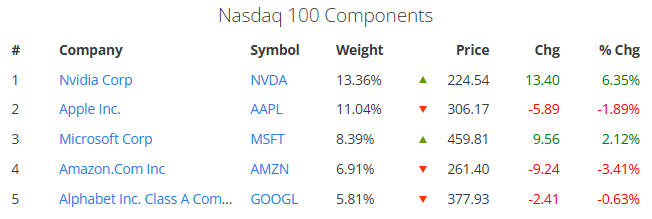
A similar effect can be seen in the demand for the main components of the Nasdaq 100. Within the index’s top five holdings, movements were mixed during the session, with Nvidia gaining +6.35% and Microsoft rising +2.12%, while Apple, Amazon, and Google posted declines of -1.89%, -3.41%, and -0.63%, respectively.
Rather than showing aligned strength across equities, this behavior reflects isolated gains and not broad-based appetite for Nasdaq 100 components. Part of this caution may be coming from uncertainty around the Middle East and the impact this could have on global inflationary pressures. For now, the index’s internal activity does not show clear buying dominance, but rather mixed movements that reinforce a phase of short-term indecision.
Source: Slickcharts
Short-term optimism may have started to turn into more consistent caution. This can already be seen in sentiment indicators and in the internal activity of equity indices such as Nasdaq. For this reason, if geopolitical conditions do not show real progress, this phase of indecision could remain relevant in the index’s price action over the coming sessions.
How is the long-term dynamic holding up?
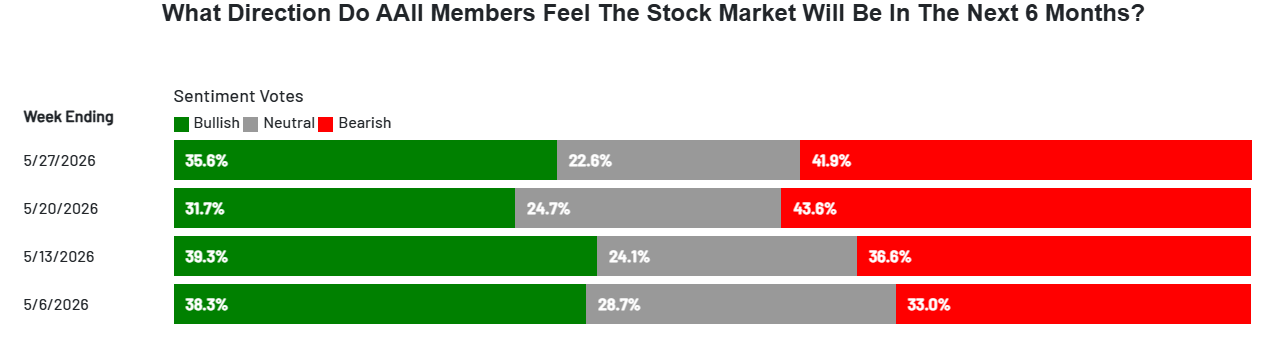
Beyond the current short-term confidence environment, the real challenge for the equity market remains the long-term perception. Although the latest AAII Investor Sentiment Survey data, as of May 27, 2026, shows an improvement in the bullish outlook for the next six months, positive sentiment remains behind.
Currently, the survey shows 35.6% bullish sentiment, compared with 22.6% neutral and 41.9% bearish. This still reflects weakened confidence and suggests that the market does not yet offer an ideal environment for equity indices such as Nasdaq over the coming months.
Source: AAII
This factor is important because, if long-term sentiment remains in bearish territory, it could be difficult to sustain consistent demand in the equity market. If macroeconomic and geopolitical conditions do not become more favorable, indices such as the Nasdaq 100 could face greater long-term doubts, which may also warn of possible phases of indecision over the coming weeks.
Technical outlook for the Nasdaq 100
Source: StoneX, Tradingview
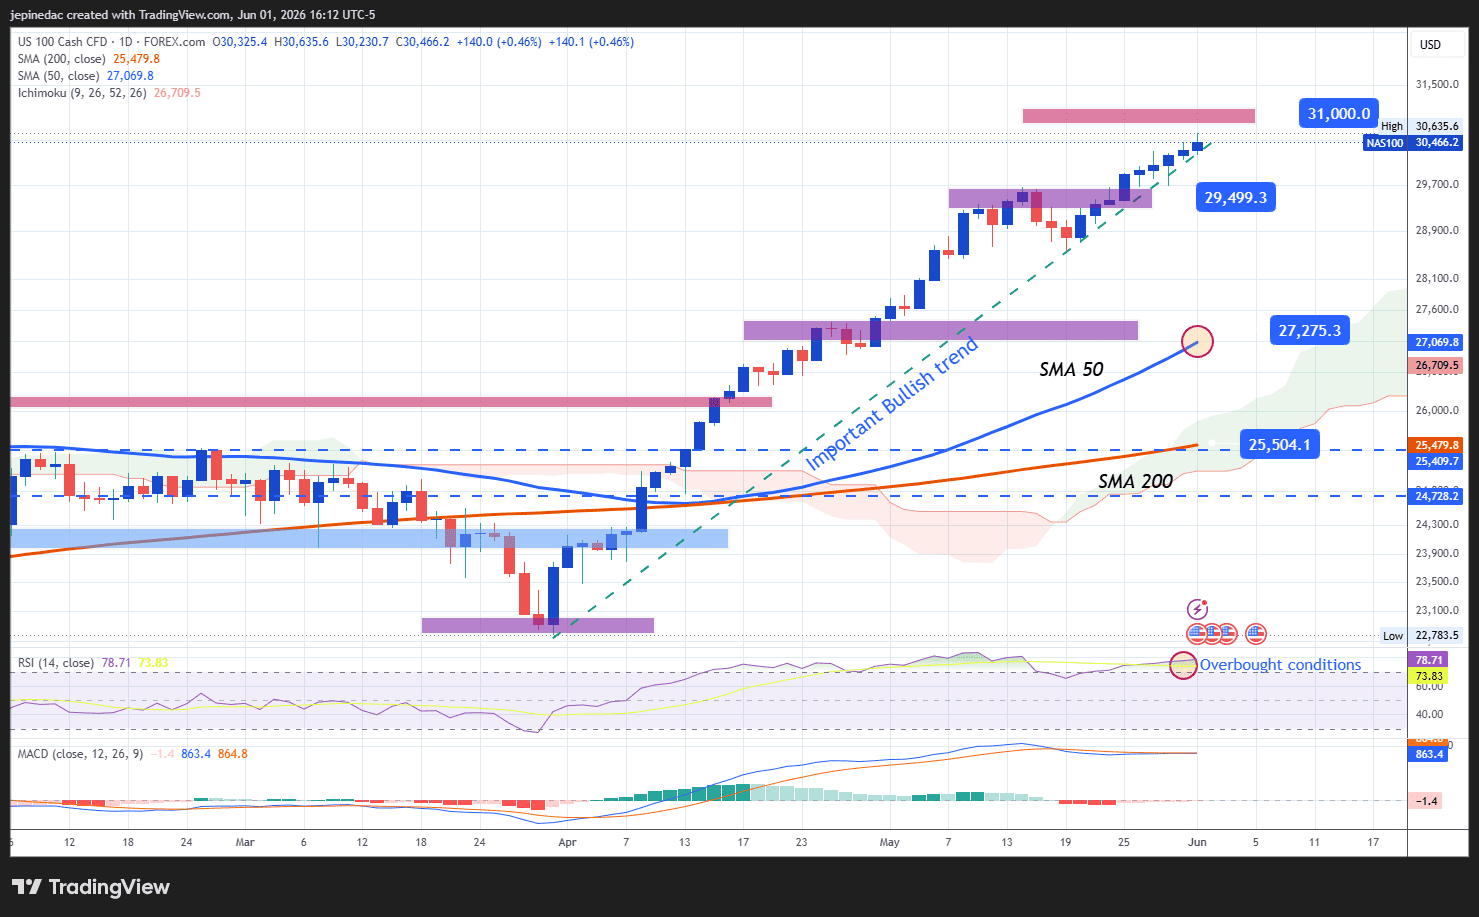
- Aggressive trendline begins to slow: Since the final days of March, average Nasdaq 100 movements have managed to sustain an aggressive bullish trendline, which remains the most relevant short-term technical structure. However, the recent neutrality in price action could be warning of a possible phase of indecision. If this behavior continues, the bullish trendline could start to come under pressure over the next few sessions.
- MACD: Now, the MACD histogram remains very close to the 0 line, indicating a balance in the strength of short-term moving averages. This behavior highlights a potential phase of neutrality in price action and, if it continues, could make indecision more relevant over the coming sessions.
- RSI: The RSI continues to move above the overbought level near 70, suggesting a momentum imbalance caused by a possible excess of buying strength in Nasdaq over recent weeks. This reading also suggests that there may still be room for potential selling corrections in the coming sessions.
Key levels:
- 31,000 points – Relevant resistance: A key psychological level given the lack of historical references. A sustained breakout above this area could reinforce the bullish bias and allow the current trend to remain the dominant pattern on the chart in the coming sessions.
- 29,500 points – Near-term barrier: A recent retracement level that stands as the immediate support to watch. This area could act as a tentative barrier if selling corrections appear in the Nasdaq over the coming sessions.
- 27,280 points – Key support: A nearby low area that stands as a relevant neutrality level and aligns with the 50-period simple moving average. Price movements toward this zone would not only put the current aggressive bullish trendline into question but could also open the door to a more consistent phase of indecision over the following sessions.
Written by Julian Pineda, CFA, CMT – Market Analyst
Follow him on: @julianpineda25


Open an account in minutes
Experience award-winning platforms with fast and secure execution, and enjoy tight spreads from 0.5 pts on FX and 0.3 pts on indices.
Economic calendar
Web Trader platform
Our sophisticated web-based platform is packed with features.
Related articles
ASX 200 Outlook: A Rates Trade Disguised as a Stock Market?
Australian bond futures have exhibited a far stronger relationship with the ASX 200 than Wall Street over recent months. Now both markets are displaying remarkably similar price structures.

Bitcoin Bulls Eye Weekend Bounce as Nasdaq Finds Support
Bitcoin bulls eye a weekend bounce as Nasdaq finds support, BTC holds $80k and bullish reversal signals emerge alongside stronger correlations.


Dow Jones Analysis: Is the DJIA Making a Comeback?
Recent trading sessions have become increasingly relevant for the Dow Jones, as the index has started to regain bullish momentum heading into the end of the week. Over the last three sessions, the DJIA has advanced by more than 0.6%, allowing buying pressure to regain prominence and raising the possibility of a more consistent short-term recovery.
This report is intended for general circulation only. It should not be construed as a recommendation, or an offer (or solicitation of an offer) to buy or sell any financial products. The information provided does not take into account your specific investment objectives, financial situation or particular needs. Before you act on any recommendation that may be contained in this report, independent advice ought to be sought from a financial adviser regarding the suitability of the investment product, taking into account your specific investment objectives, financial situation or particular needs.
StoneX Financial Pte. Ltd., may distribute reports produced by its respective foreign entities or affiliates within the StoneX group of companies or third parties pursuant to an arrangement under Regulation 32C of the Financial Advisers Regulations. Where the report is distributed to a person in Singapore who is not an accredited investor, expert investor or an institutional investor (as defined in the Securities Futures Act), StoneX Financial Pte. Ltd. accepts legal responsibility to such persons for the contents of the report only to the extent required by law. Singapore recipients should contact StoneX Financial Pte. Ltd. at 6826 9988 for matters arising from, or in connection with the report.
In the case of all other recipients of this report, to the extent permitted by applicable laws and regulations neither StoneX Financial Pte. Ltd. nor its associated companies will be responsible or liable for any loss or damage incurred arising out of, or in connection with, any use of the information contained in this report and all such liability is hereby expressly disclaimed. No representation or warranty is made, express or implied, that the content of this report is complete or accurate.
StoneX Financial Pte. Ltd. is not under any obligation to update this report.
Trading CFDs carries a high level of risk that may not be suitable for some investors. Consider your investment objectives, level of experience, financial resources, risk appetite and other relevant circumstances carefully. The possibility exists that you could lose some or all of your investments, including your initial deposits. If in doubt, please seek independent expert advice. Visit www.forex.com/en-sg/terms-and-policies for the complete Risk Disclosure Statement.