


Nasdaq 100 Coils Ahead of ASML Earnings as AI Leadership Faces a Test
The Nasdaq 100 consolidates ahead of ASML earnings as leadership fades, market breadth improves and traders await fresh clues on AI demand.
Share this:

The Nasdaq 100 heads into a pivotal week of earnings in consolidation mode, with semiconductor equipment giant ASML due to report before Wednesday's US open. The results will be closely scrutinised for clues on AI-related capital spending, customer demand and forward guidance, particularly after recent volatility in chip stocks has raised questions over the durability of the AI trade.
View related analysis:
View related analysis:
Nasdaq Consolidates Ahead of ASML's AI Earnings Test
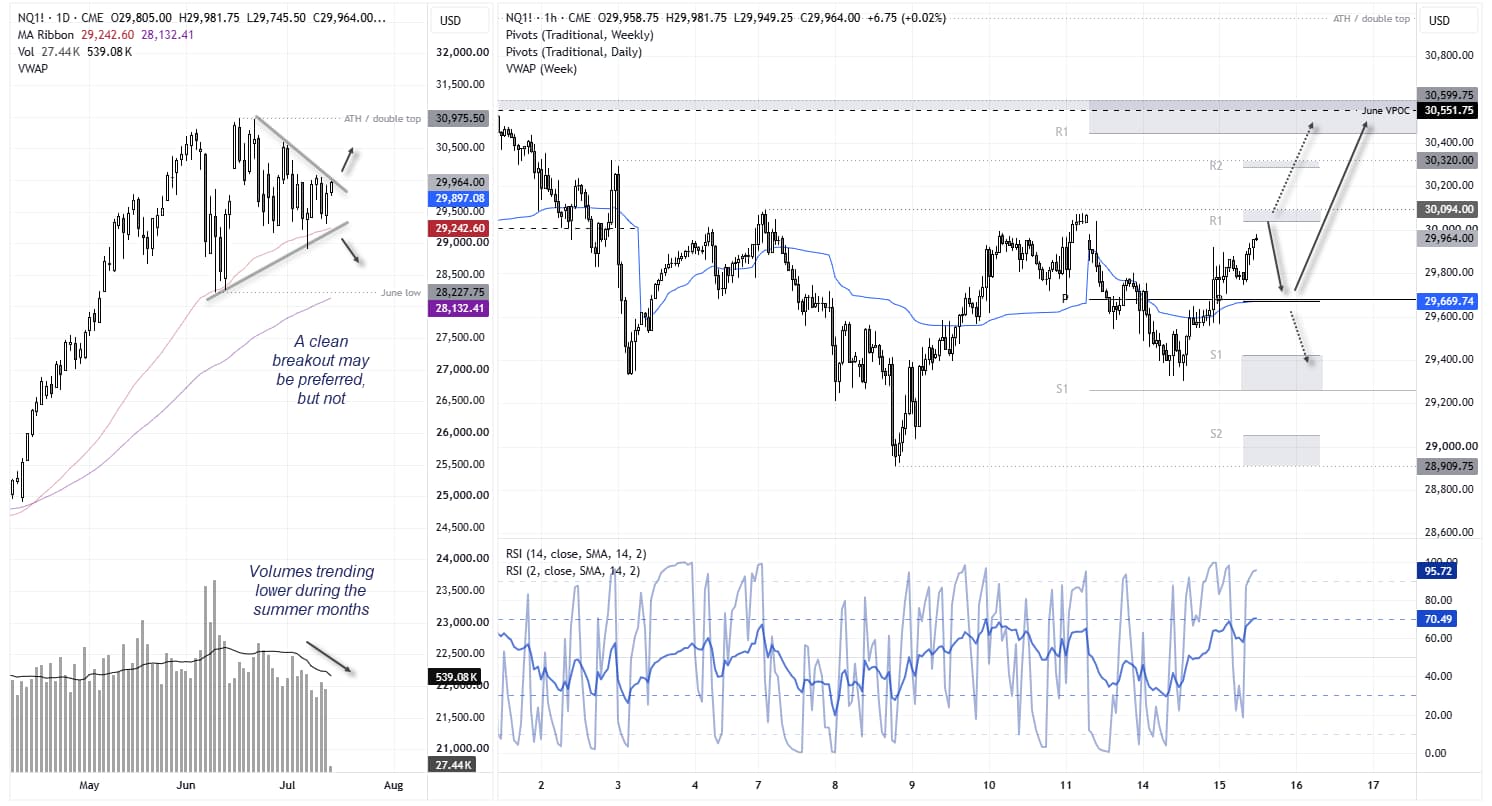
Beneath the surface, leadership has begun to shift ahead of earnings season. While the Nasdaq 100 continues to consolidate near record highs, its relative performance versus the Dow Jones Industrial Average, S&P 500 and broader Nasdaq Composite has weakened since early June. The improving percentage of stocks trading above their 200-day moving average also points to broader market participation, suggesting investors have been rotating beyond the largest technology names rather than exiting equities altogether.
That puts semiconductor equipment maker ASML firmly in the spotlight. As the first major AI bellwether to report this earnings season, its outlook on customer investment, AI-related demand and capital expenditure could determine whether the Nasdaq 100 regains market leadership or whether the recent rotation into the broader market gathers further momentum.
Source: NASDAQ, LSEG
- Orange (NDX/DJI): Nasdaq has underperformed the Dow since early June.
- Magenta (NDX/SPX): Nasdaq has also lost ground relative to the S&P 500.
- Blue (NDX/IXIC): Mega-cap tech has underperformed the broader Nasdaq Composite, pointing to broader market leadership.
Nasdaq Leadership Fades Ahead of Earnings
Whether that rotation proves healthy or marks the beginning of broader weakness may depend on what ASML says about AI demand and semiconductor investment. As the world's leading supplier of extreme ultraviolet (EUV) lithography machines, ASML sits at the heart of the AI supply chain, making its outlook one of the most important early reads on the health of the sector ahead of TSMC and the Magnificent Seven earnings later this month.


ASML Stock Technical Analysis
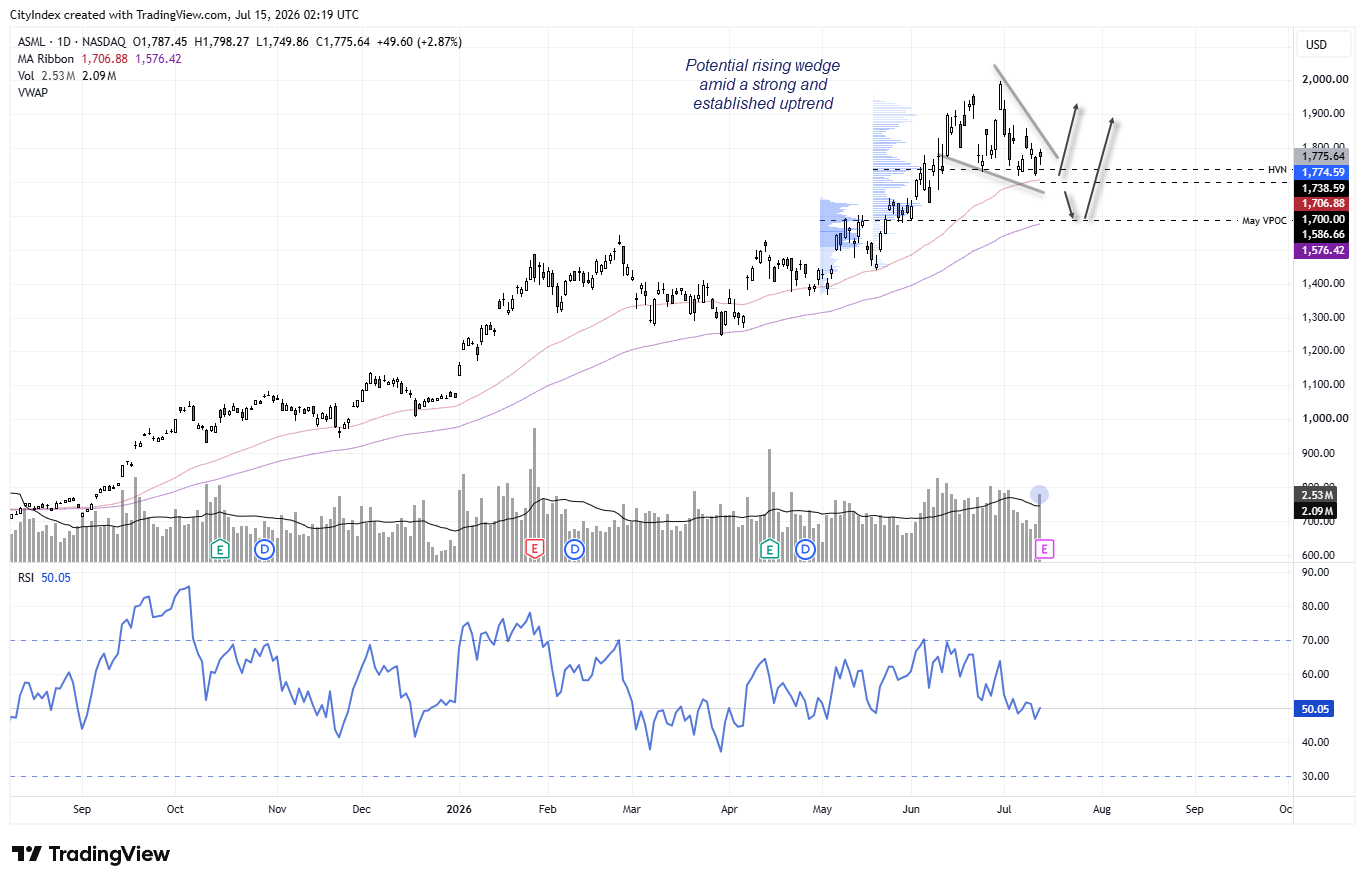
It has been just eight days since ASML last printed a record high, yet the stock has fallen as much as 14% from its peak. While a weak earnings report could trigger a much deeper pullback and weigh on Nasdaq sentiment, there are technical clues suggesting the bulls may not be finished with the trend just yet.
Price action has become increasingly choppy on the daily chart, but it also appears to be carving out a falling wedge—a pattern often associated with bullish reversals within an established uptrend. Prices are also attempting to hold above the 50-day EMA and a prominent high-volume node (HVN). Note the double bottom around 1,720, while Tuesday's narrow-range doji formed on elevated volume, hinting that buyers may be defending support.
Source: NASDAQ, TradingView
- A disappointing earnings report could trigger a gap lower, with a break beneath 1,700 exposing the 100-day EMA and May's volume point of control (VPOC) around 1,580.
- Even if prices initially move lower, the broader daily uptrend remains well established, suggesting bargain hunters may be waiting to buy any meaningful dip.
- If ASML can hold above 1,700 over the near term, a move back towards 1,900 remains possible. A break above that level would bring the 2,000 milestone into focus.


Nasdaq 100 Futures (NQ) Technical Analysis
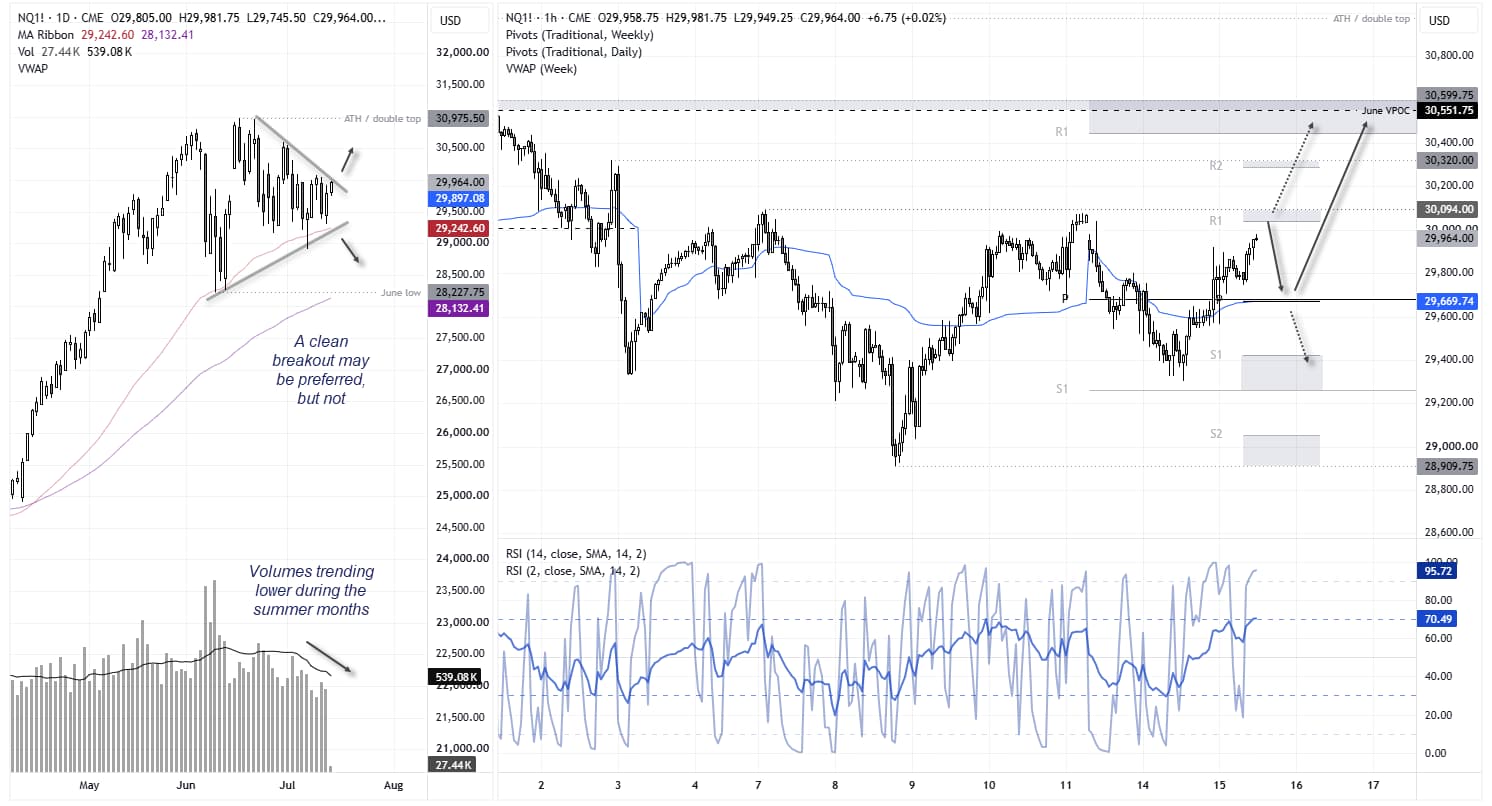
The daily chart shows Nasdaq 100 futures (NQ) coiling within a tight triangle. While this suggests volatility may be just around the corner, traders should also be alert to false breakouts and fickle price action during the quieter summer months on Wall Street. Declining trading volumes also point to lower participation in the futures market, increasing the risk of choppy moves.
While much of the near-term outlook may hinge on ASML's earnings report, I have an inkling. I have also highlighted key support and resistance zones where bulls and bears may look for reversal signals or breakout confirmation.
Source: CME, TradingView
View the full economic calendar
View the full economic calendar
-- Written by Matt Simpson
Follow Matt on Twitter @cLeverEdge
How to trade with City Index
You can trade with City Index by following these four easy steps:
- Open an account, or log in if you’re already a customer
• Open an account in the UK
• Open an account in Australia
• Open an account in Singapore
- Search for the market you want to trade in our award-winning platform
- Choose your position and size, and your stop and limit levels
- Place the trade
Latest market news




Open an account in minutes
Experience award-winning platforms with fast and secure execution, and enjoy tight spreads from 0.5 pts on FX and 0.3 pts on indices.
Economic calendar
Web Trader platform
Our sophisticated web-based platform is packed with features.
Related articles

Stocks on Watch After CPI-Fueled Breakdown: SPX, Nasdaq, NVDA
Coming into the week there was an early case of divergence as AI and tech had started to show lag behind the S&P. That shift is growing more noticeable following a higher-than-expected CPI print.


Nasdaq 100 Forecast: NDX falls after hotter inflation data
U.S. stocks are falling after hotter-than-expected U.S. inflation data, which has lifted Fed rate hike expectations.


Hang Seng Tech: Improving earnings can't stop the technical breakdown
Hang Seng Tech continues to slide despite improving earnings expectations across many major constituents. With valuations contracting and key technical support broken, the question is whether the selling has further to run.

This report is intended for general circulation only. It should not be construed as a recommendation, or an offer (or solicitation of an offer) to buy or sell any financial products. The information provided does not take into account your specific investment objectives, financial situation or particular needs. Before you act on any recommendation that may be contained in this report, independent advice ought to be sought from a financial adviser regarding the suitability of the investment product, taking into account your specific investment objectives, financial situation or particular needs.
StoneX Financial Pte. Ltd., may distribute reports produced by its respective foreign entities or affiliates within the StoneX group of companies or third parties pursuant to an arrangement under Regulation 32C of the Financial Advisers Regulations. Where the report is distributed to a person in Singapore who is not an accredited investor, expert investor or an institutional investor (as defined in the Securities Futures Act), StoneX Financial Pte. Ltd. accepts legal responsibility to such persons for the contents of the report only to the extent required by law. Singapore recipients should contact StoneX Financial Pte. Ltd. at 6826 9988 for matters arising from, or in connection with the report.
In the case of all other recipients of this report, to the extent permitted by applicable laws and regulations neither StoneX Financial Pte. Ltd. nor its associated companies will be responsible or liable for any loss or damage incurred arising out of, or in connection with, any use of the information contained in this report and all such liability is hereby expressly disclaimed. No representation or warranty is made, express or implied, that the content of this report is complete or accurate.
StoneX Financial Pte. Ltd. is not under any obligation to update this report.
Trading CFDs carries a high level of risk that may not be suitable for some investors. Consider your investment objectives, level of experience, financial resources, risk appetite and other relevant circumstances carefully. The possibility exists that you could lose some or all of your investments, including your initial deposits. If in doubt, please seek independent expert advice. Visit www.forex.com/en-sg/terms-and-policies for the complete Risk Disclosure Statement.