



Dow Jones Record Leaves Nasdaq Trailing, ASX Set for Chop
The Dow Jones hit another record high as investors rotated away from technology stocks, while the ASX 200 looks set for a range-bound session beneath key resistance.
Share this:

Wall Street delivered a split performance after weaker-than-expected US jobs data, with the Dow Jones extending its record-breaking run while the Nasdaq 100 fell sharply as semiconductor and AI stocks remained under pressure. The ASX 200 staged an encouraging reversal on Thursday, but nearby options resistance and technical barriers suggest traders may need to brace for a choppy finish to the week.
View related analysis:
- AUD/USD Outlook 2026: Key Drivers for the Australian Dollar in Q3
- USD/JPY Caught Between NFP, the Fed and MOF Intervention Risk
- USD/CAD Eyes Pullback as CAD/JPY Decouples from Crude Oil, AUD/CAD Stabilises
- FX Futures Positioning: GBP Shorts Hit Records as USD Rally Slows | COT Report
- Australian Dollar Outlook: AUD/USD Shows Early Signs of a Swing Low
View related analysis:
- AUD/USD Outlook 2026: Key Drivers for the Australian Dollar in Q3
- USD/JPY Caught Between NFP, the Fed and MOF Intervention Risk
- USD/CAD Eyes Pullback as CAD/JPY Decouples from Crude Oil, AUD/CAD Stabilises
- FX Futures Positioning: GBP Shorts Hit Records as USD Rally Slows | COT Report
- Australian Dollar Outlook: AUD/USD Shows Early Signs of a Swing Low
Dow Jones Leads While ASX 200 Tests Key Resistance
Dow Leads as Wall Street Rotation Hits Tech
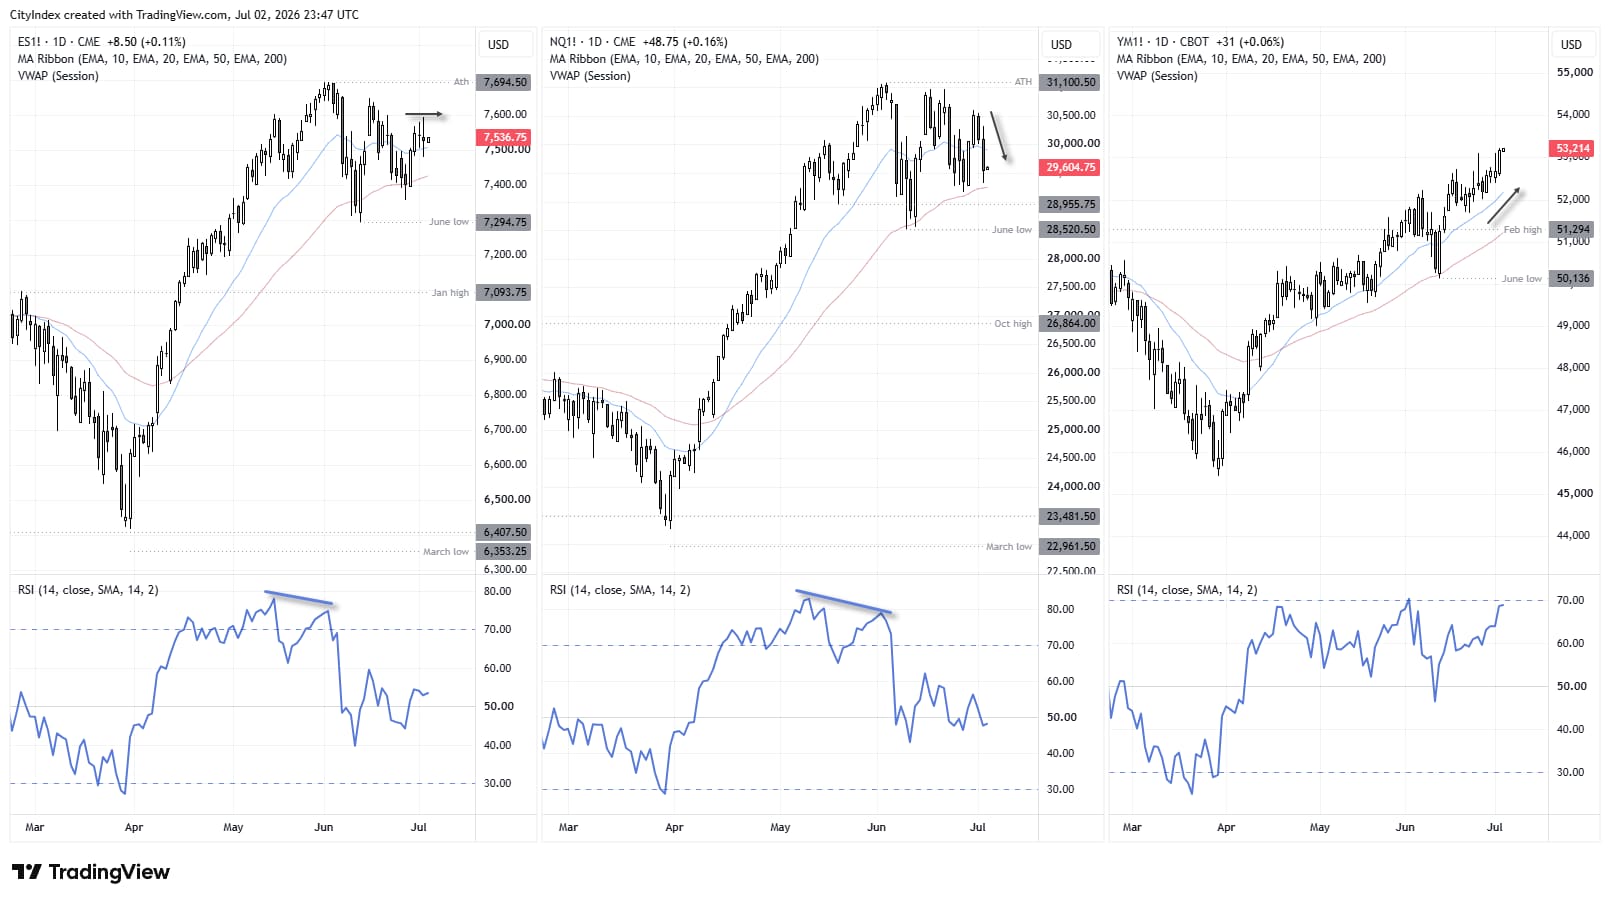
Wall Street moved in three separate ways on Thursday following a weaker-than-expected nonfarm payrolls (NFP) report. The Dow Jones reached a record high, rising more than 1% during its best session in nearly three weeks and posting its fifth consecutive bullish candle. The Nasdaq 100 fell 1.6% to a three-day low, while the S&P 500 finished little changed.
The Dow benefited from falling Treasury yields and a rotation into value, defensive sectors and mega-cap industrials. In contrast, the Nasdaq 100 came under pressure as its heavy exposure to semiconductor and AI stocks left it vulnerable to the ongoing technology sell-off, overwhelming any support from lower bond yields. Meanwhile, the S&P 500 was caught between the two, with broad-based gains across most sectors offset by weakness in its largest technology constituents.
Source: CME, CBOT, TradingView
Dow Jones Futures (YM) Technical Analysis
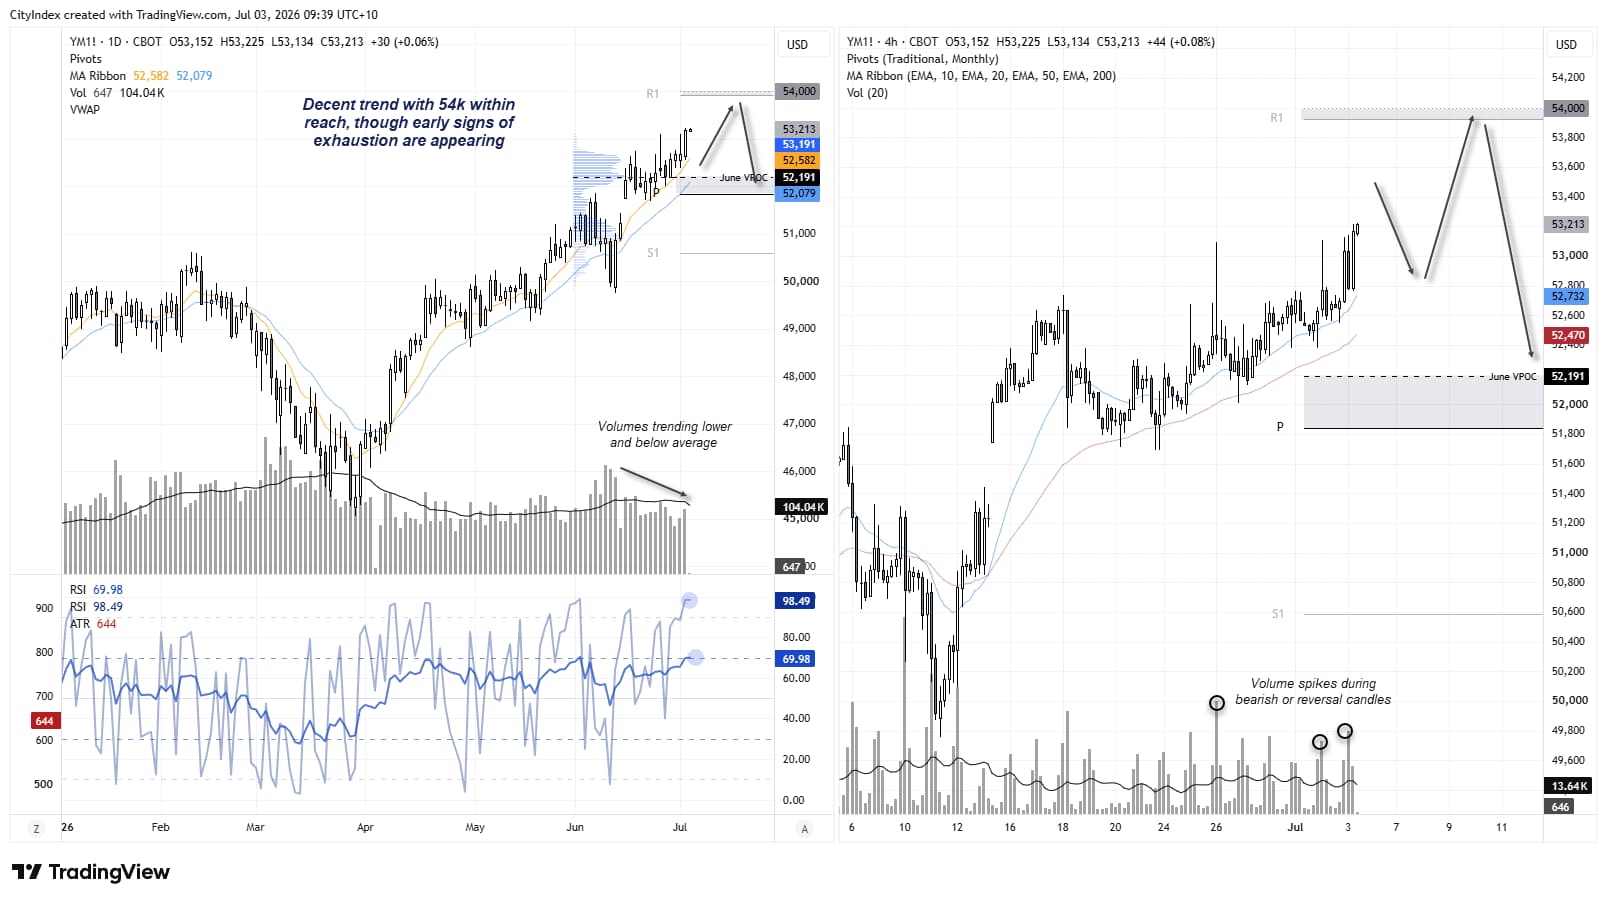
The daily chart shows a steady uptrend in Dow Jones futures that is neither excessive nor overstretched. Thursday's bullish range expansion day saw price rebound from the 10-day EMA and close above 53,000, with the monthly R1 pivot and the 54,000 handle sitting roughly one day's average true range (ATR) of 632 points above. While this does not guarantee the Dow Jones will reach that area within a single session, it suggests the move is well within the market's historical volatility range over the past 14 trading days.


Potential Dow Jones Support Around 52,000
Note that June's volume point of control (VPOC) sits near the 20-day EMA, just above the monthly pivot point, providing a potential support zone around 52,000.
With the daily RSI (2) at an extremely overbought reading of 98.36, bulls may need to tread carefully. However, given the strength of the uptrend, nearby support levels, and Wall Street traders' preference for the Dow over the Nasdaq and S&P 500, any pullbacks may continue to attract buyers.
Source: ICE, TradingView
ASX 200 (XJO), SPI 200 (AP1) Technical Analysis
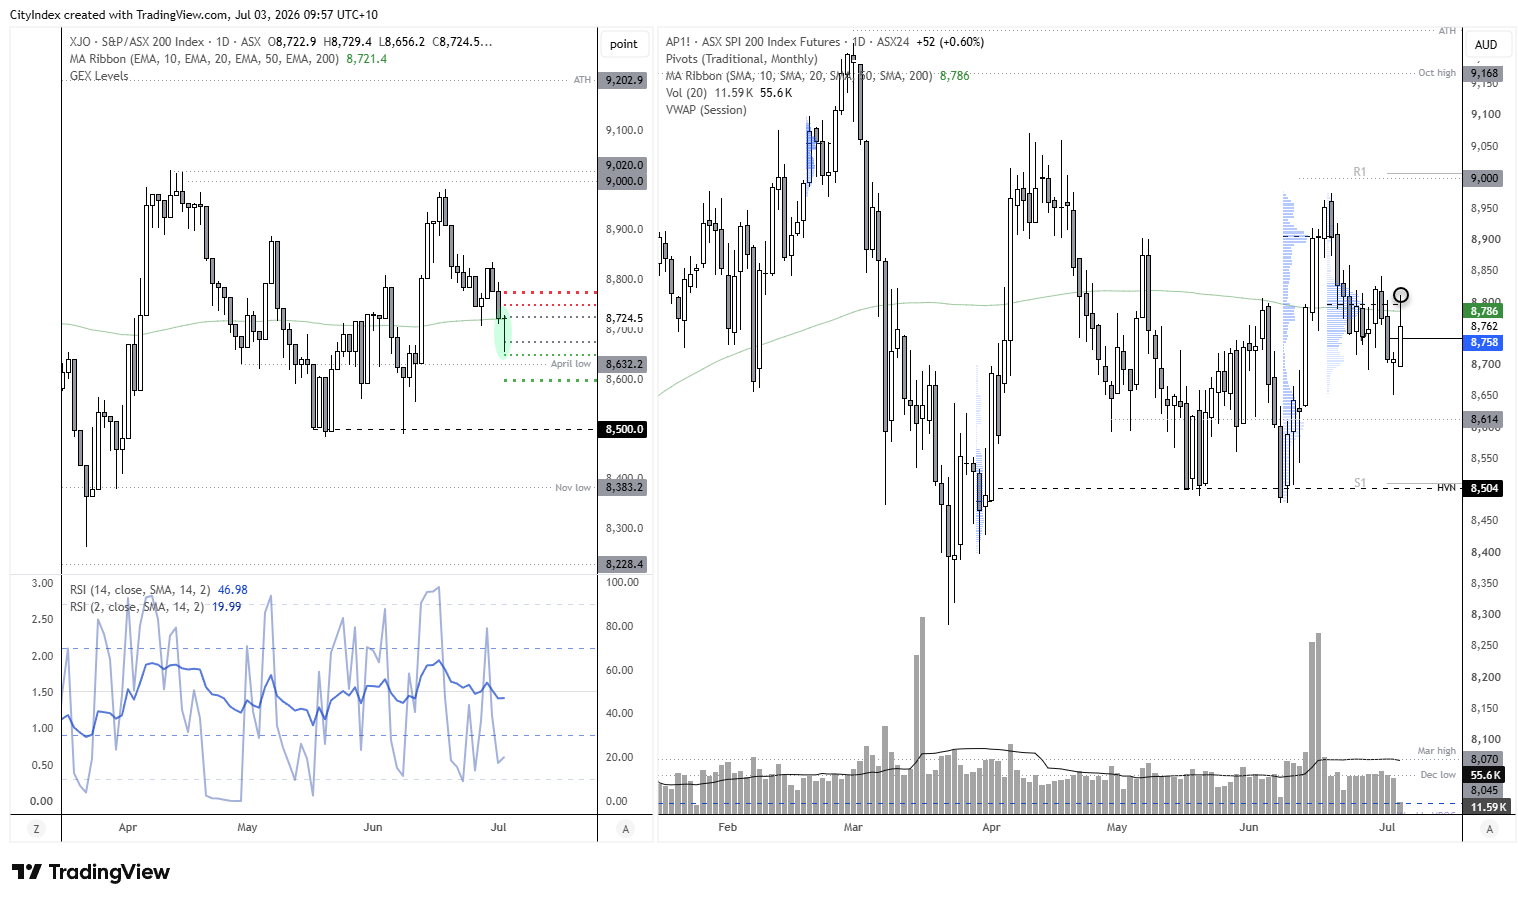
Thursday was initially off to a poor start, with the ASX tumbling beneath its 200-day EMA. Yet those losses were fully reversed for an effectively flat close, leaving a bullish pinbar around its 200-day average. The fact the bullish reversal occurred above the April low and the 8650 put cluster adds weight to the case for a swing low, although that does not necessarily mean it will be plain sailing for bulls from here.
The options market also points to resistance overhead. The largest call open interest sits at 8750 and 8775, creating a nearby gamma ceiling where rallies could stall unless buyers can secure a convincing break above it. For now, the 8650 put cluster provides the first line of support on any pullback.
The rebound on SPI 200 futures overnight also met resistance at its own 200-day EMA, reinforcing the importance of the 8750–8775 region heading into Friday.
Source: ICE, TradingView
ASX 200 1-Hour Chart Analysis
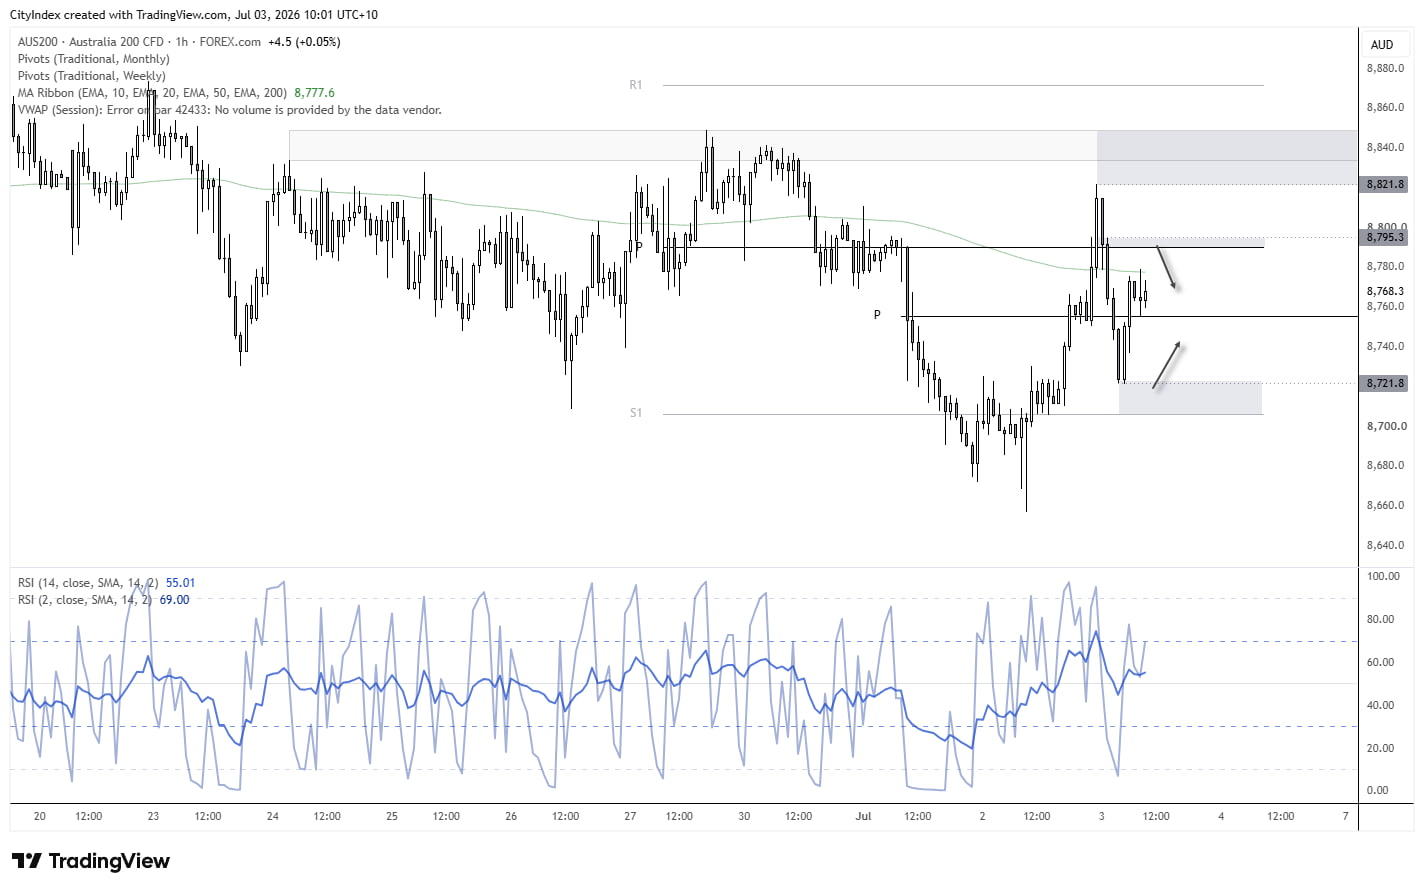
The 1-hour chart shows the ASX caught between a rock and a hard place, trapped between the weekly and monthly pivot points, with the 200-hour EMA also capping gains for now. Given Friday tends to be the least volatile day of the week, conditions could remain choppy with fickle price action. Bears may therefore look to fade rallies into resistance around the monthly pivot point or the 8800 handle, while bulls may seek buying opportunities around support levels such as Thursday's 8721 low or the 8700 handle near the weekly S1 pivot.
Source: Forex.com, TradingView
View the full economic calendar
View the full economic calendar
-- Written by Matt Simpson
Follow Matt on Twitter @cLeverEdge
How to trade with City Index
You can trade with City Index by following these four easy steps:
- Open an account, or log in if you’re already a customer
• Open an account in the UK
• Open an account in Australia
• Open an account in Singapore
- Search for the market you want to trade in our award-winning platform
- Choose your position and size, and your stop and limit levels
- Place the trade
Related tags:


Open an account in minutes
Experience award-winning platforms with fast and secure execution, and enjoy tight spreads from 0.5 pts on FX and 0.3 pts on indices.
Economic calendar
Web Trader platform
Our sophisticated web-based platform is packed with features.
Related articles
USD/JPY, Nikkei Break Lower as AI Meltdown Spreads
Thursday’s tech tantrum has become Friday’s fire sale. With Nikkei support giving way and the yen strengthening, could the selling start feeding on itself?

Nasdaq, Treasury yields and dollar face a major AI sentiment test
From crude to AI, the forces driving US markets have changed dramatically. Thursday's Nasdaq rout triggered an extraordinary Treasury rally, but the dollar barely moved. What happens next could depend on Nasdaq support.

Japanese Yen Surges Across FX Majors as Risk Aversion Intensifies
Safe-haven demand sent the Japanese yen higher across FX majors, while USD/JPY broke lower ahead of Japan's CPI release and next week's BOJ meeting.
This report is intended for general circulation only. It should not be construed as a recommendation, or an offer (or solicitation of an offer) to buy or sell any financial products. The information provided does not take into account your specific investment objectives, financial situation or particular needs. Before you act on any recommendation that may be contained in this report, independent advice ought to be sought from a financial adviser regarding the suitability of the investment product, taking into account your specific investment objectives, financial situation or particular needs.
StoneX Financial Pte. Ltd., may distribute reports produced by its respective foreign entities or affiliates within the StoneX group of companies or third parties pursuant to an arrangement under Regulation 32C of the Financial Advisers Regulations. Where the report is distributed to a person in Singapore who is not an accredited investor, expert investor or an institutional investor (as defined in the Securities Futures Act), StoneX Financial Pte. Ltd. accepts legal responsibility to such persons for the contents of the report only to the extent required by law. Singapore recipients should contact StoneX Financial Pte. Ltd. at 6826 9988 for matters arising from, or in connection with the report.
In the case of all other recipients of this report, to the extent permitted by applicable laws and regulations neither StoneX Financial Pte. Ltd. nor its associated companies will be responsible or liable for any loss or damage incurred arising out of, or in connection with, any use of the information contained in this report and all such liability is hereby expressly disclaimed. No representation or warranty is made, express or implied, that the content of this report is complete or accurate.
StoneX Financial Pte. Ltd. is not under any obligation to update this report.
Trading CFDs carries a high level of risk that may not be suitable for some investors. Consider your investment objectives, level of experience, financial resources, risk appetite and other relevant circumstances carefully. The possibility exists that you could lose some or all of your investments, including your initial deposits. If in doubt, please seek independent expert advice. Visit www.forex.com/en-sg/terms-and-policies for the complete Risk Disclosure Statement.