


New Zealand dollar outlook: NZD/USD bearish bias strengthens into key data
The Kiwi’s October rally has been wiped out as Powell’s hawkish tone sparks a sharp reversal. With key labour market data looming, downside risks are mounting fast.
Share this:

- Powell’s hawkish tone flipped NZD/USD bearish
- Weekly shooting star warns of downside risk
- Rising wedge break on dailies opens path to October lows
- Jobs data could drive next RBNZ move
Summary
The price action in NZD/USD turned decidedly bearish last week, coinciding with a renewed bout of U.S. dollar strength sparked by a recalibration of the U.S. interest rate outlook as Jerome Powell cast doubt on whether the FOMC will deliver a third consecutive rate cut in December. Traders had deemed such an outcome a near lock, resulting in a wave of pressure on U.S. dollar-denominated assets, including markets important to the Kiwi such as dairy prices. If the signals on the charts prove reliable, downside risks for NZD/USD are building as we near the release of crucial employment data in New Zealand.
Kiwi Slides on Powell Pivot
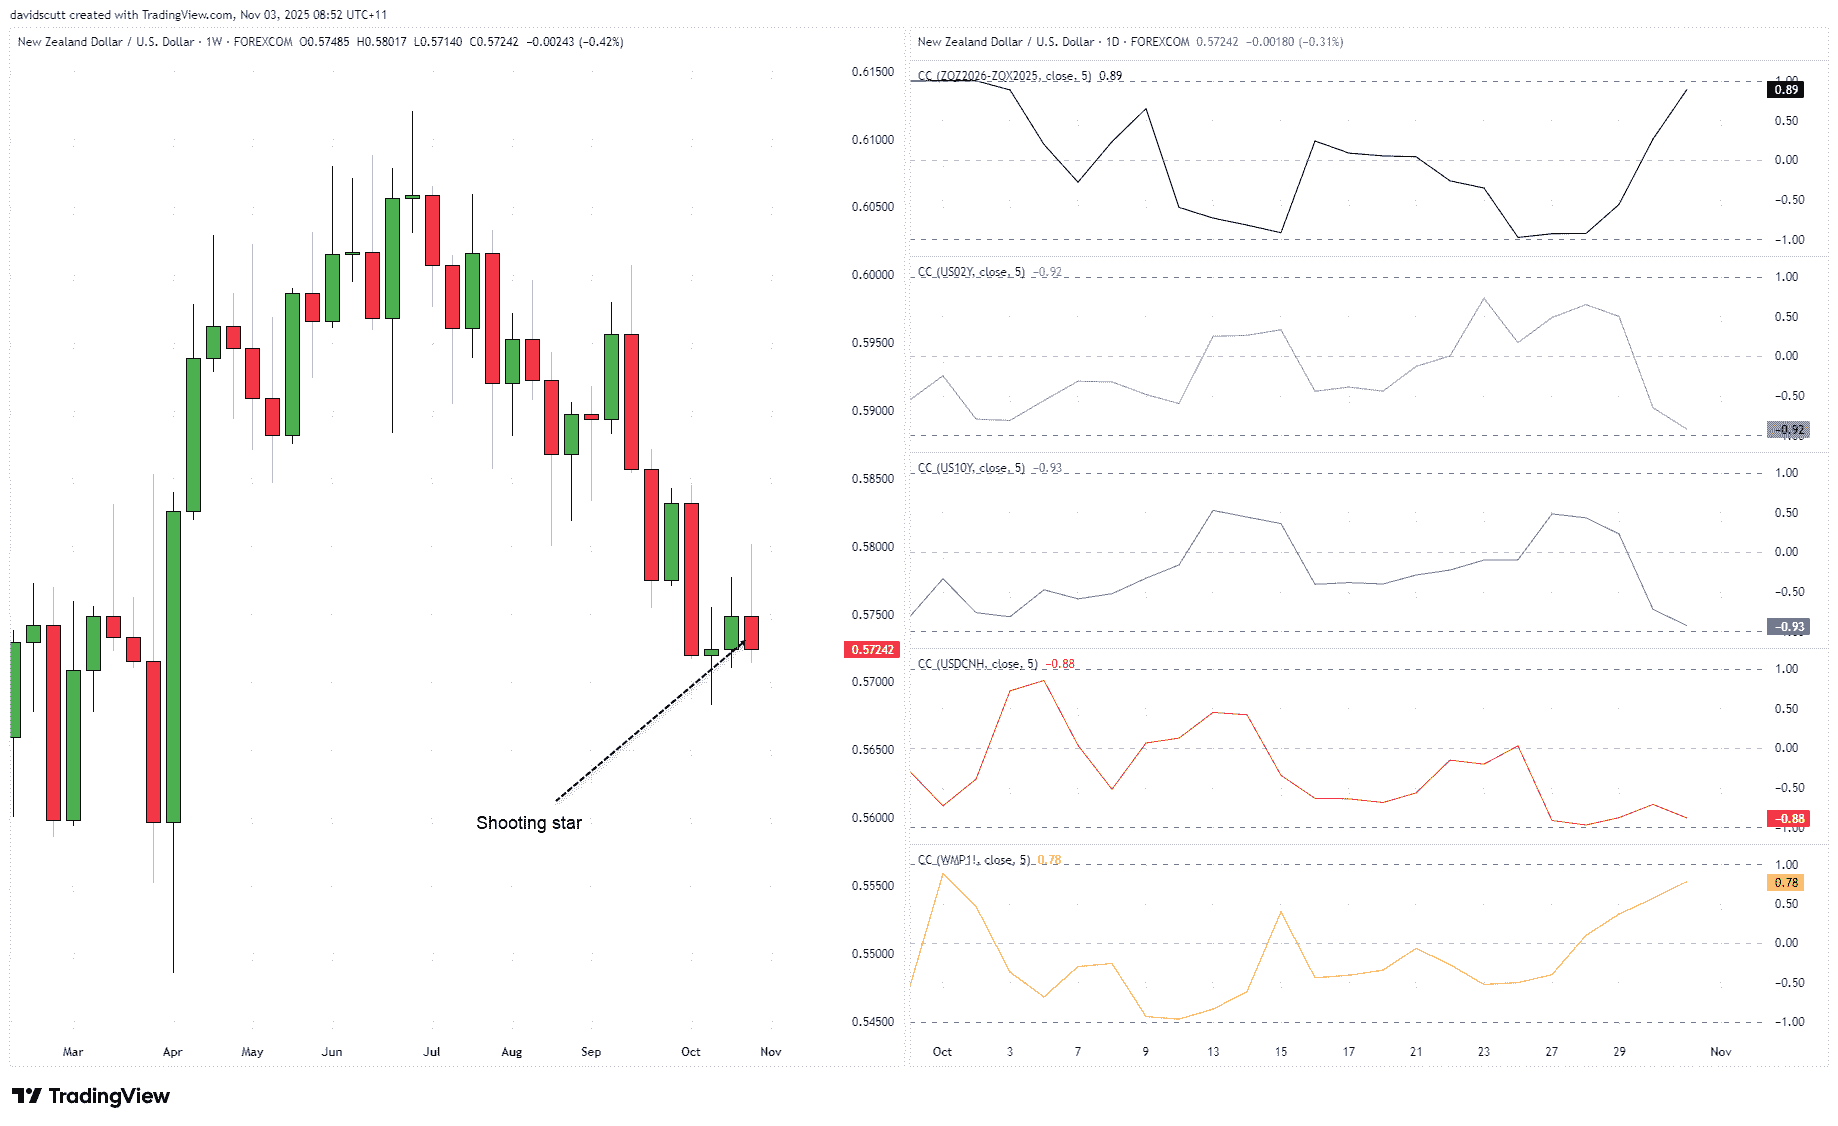
Like so many other riskier asset classes, the hawkish tilt from Jerome Powell following the October FOMC meeting weighed heavily on the Kiwi dollar, resulting in a sharp reversal that changed the picture entirely for NZD/USD across multiple timeframes. That can be seen in the left-hand pane of the chart below, with a shooting star printing on the weeklies, warning of renewed downside even if it didn’t arrive after an extended uptrend.
Source: TradingView
The bearish signal followed a sharp lift in the rolling five-day correlation between NZD/USD and multiple tenors across the U.S. interest rate curve, as demonstrated in the right-hand pane. From top to bottom, we have implied market pricing for Fed rate cuts out to the end of next year, with two- and 10-year Treasury yields following next. At 0.89, -0.92 and -0.93 respectively, it’s clear that as U.S. yields rose, NZD/USD typically declined. Given the strength of the relationship NZD/USD saw with the offshore-traded Chinese yuan and whole milk powder futures traded on the SGX, which are the fourth and fifth correlation coefficients shown, the Kiwi wasn’t the only cyclical asset undermined by the Fed’s less-dovish shift, creating an environment conducive to weakness.


Rising Wedge Break Warns of Downside Risk
Source: TradingView
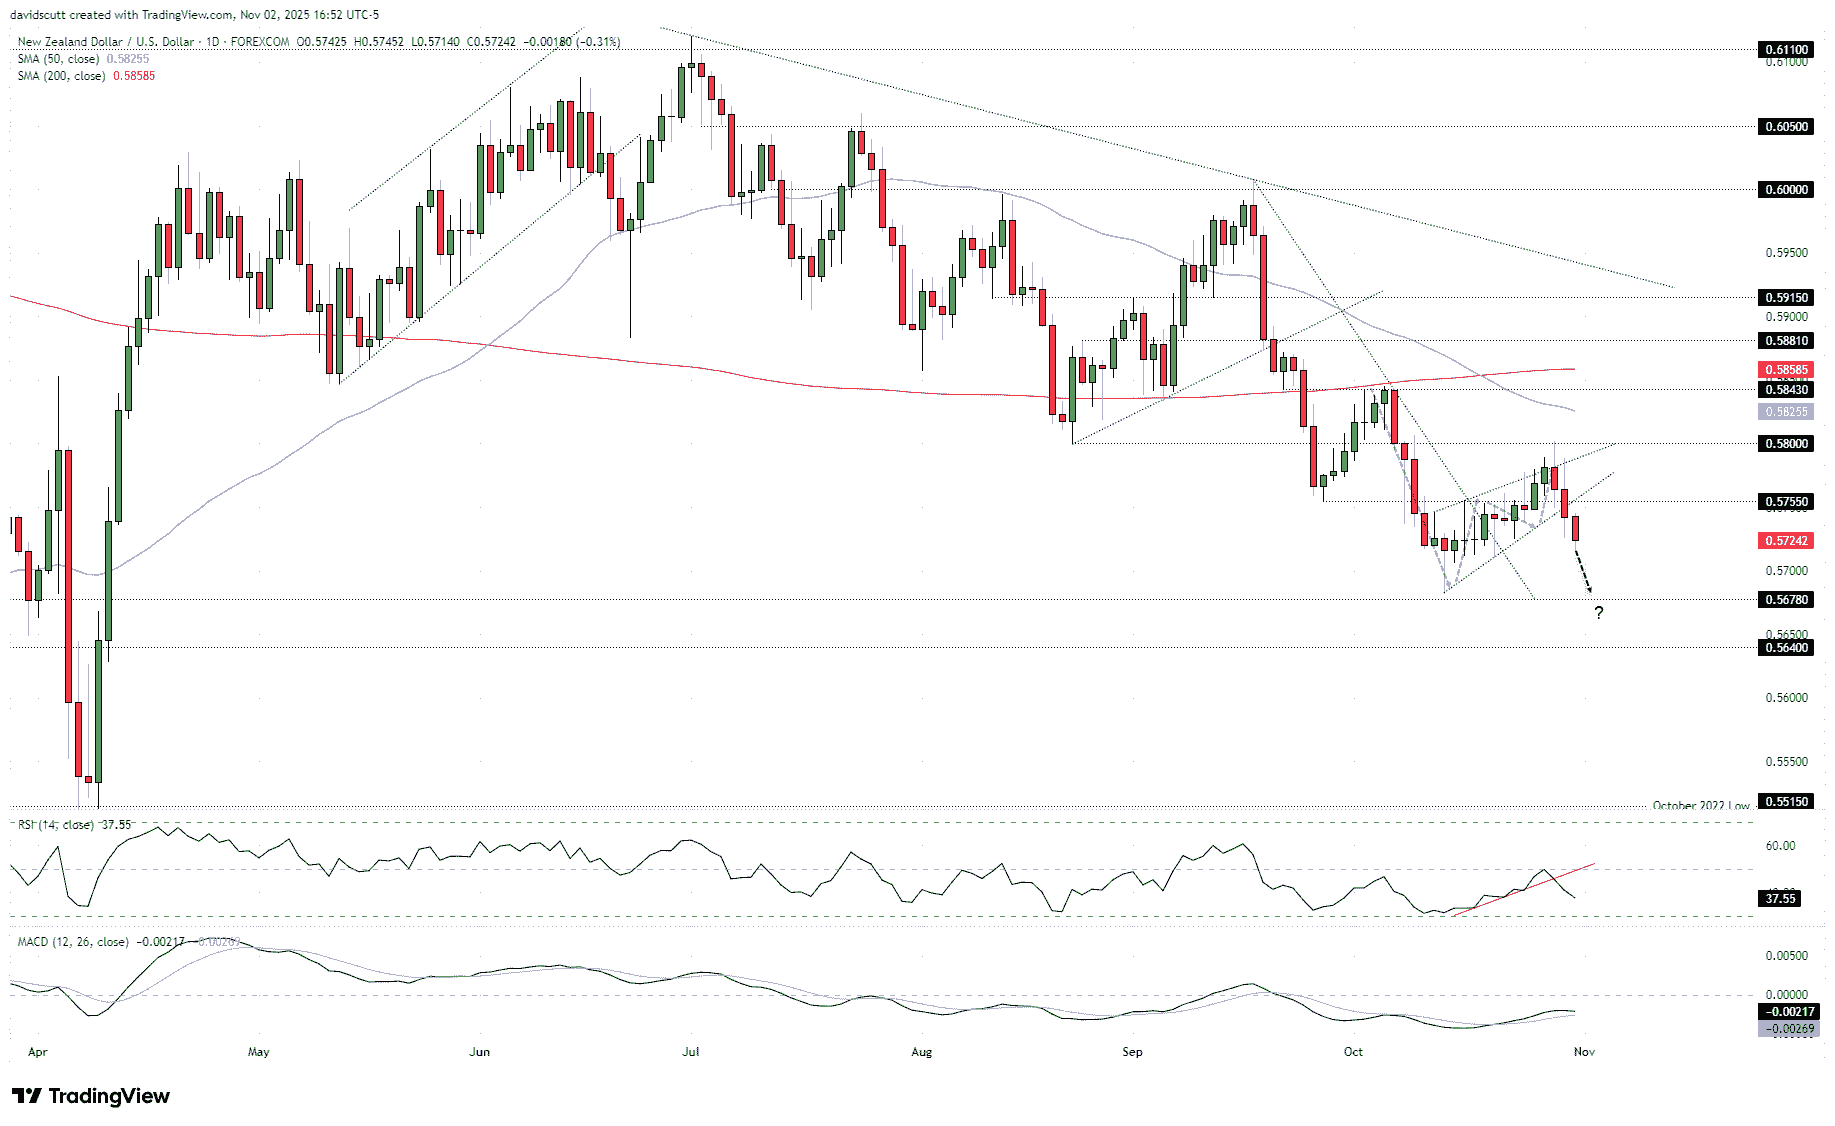
Like the message from the NZD/USD weekly chart, the signals from the daily only add to the bearish picture, with a key reversal candle printing on Wednesday after failing at .5800 resistance, contributing to follow-through selling that saw the pair deliver a bearish break of the rising wedge it had been trading in. Having sliced through uptrend support, convention suggests a potential retest of the October low around .5683 may be on the cards, with .5678 and .5640 other known support levels after that.
Mirroring the price action, the momentum picture has shifted far more bearish, with RSI (14) through its uptrend and now sinking further away from neutral territory, pointing to strengthening downside pressure. MACD looks like it may soon confirm, curling over towards the signal line from above while remaining firmly in negative territory. The pair just looks heavy and vulnerable to downside.
The one small area of caution is the price action seen in mid-October, with multiple bearish probes beneath .5715 resulting in reversals. The macro backdrop is not the same, but it should be a consideration for anyone looking at shorts around these levels. The preference would be to sell into rallies towards minor resistance at .5755, should the price return there. That would create a more appealing setup where stops could be placed above to protect against reversal. If the pair were to reverse back above .5755 and close there, the bearish bias would be nixed, putting potential long setups in play seeking a return initially to .5800 resistance.
Kiwi Unemployment Data Looms Large
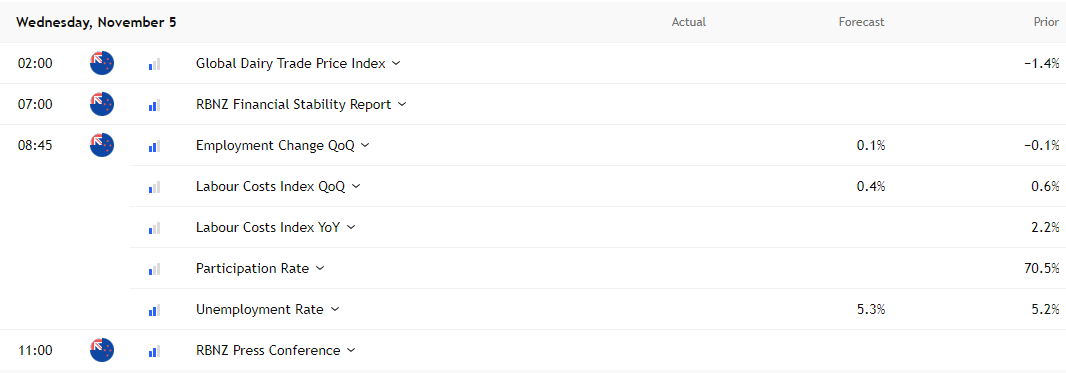
While the U.S. calendar has some decent risk events this week, as covered in a separate note looking at USD/JPY, the domestic calendar in New Zealand may contain the biggest source of volatility with the release of crucial labour market data for the September quarter. While the Reserve Bank of New Zealand (RBNZ) has a sole inflation mandate, more recently its decision-making process has been heavily influenced the labour market. Unemployment has continued to trend higher even with participation rates falling, keeping the domestic inflation outlook subdued.
Source: TradingView (AEDT)
Should the data released on Wednesday fail to show any meaningful recovery in the labour market, it will increase the probability of the RBNZ adding to the 300 basis points of rate cuts already delivered this cycle. While a 25-basis-point cut at the bank’s final meeting of the year on November 26 is nearly fully priced, with the RBNZ not afraid to deliver large cuts as seen by the 50-point reduction in October, continued signs of weakness may see traders begin to price the cash rate falling beneath 2% this cycle. Only an across-the-board beat in key labour market measures would likely be enough to see markets begin to reduce the probability of further easing this cycle.
Based on the RBNZ’s latest forecasts, it sees unemployment peaking at 5.3% in Q3 with no employment growth and a participation rate of 70.4%. Private sector wages—which typically are influential on domestic inflation pressures—are seen lifting 0.4% for the quarter and 2.1% for the year, the latter in line with the midpoint of the RBNZ’s 1–3% inflation target band. Unless estimated economic slack is not as significant as thought, the latter points to a subdued outlook for overall inflationary pressures.


Open an account in minutes
Experience award-winning platforms with fast and secure execution, and enjoy tight spreads from 0.5 pts on FX and 0.3 pts on indices.
Economic calendar
Web Trader platform
Our sophisticated web-based platform is packed with features.
Related articles
USD/JPY weekly outlook: Quarter turn scrambles rates regime
USD/JPY’s tight relationship with front-end US rates broke down sharply last week, but quarter-turn flows and positioning suggest the disconnect may prove temporary.

USD/CAD forecast: rally could accelerate above June highs at 1.4250
USD/CAD recovered quickly after weaker US jobs data, keeping the bullish trend in focus. A move above the June highs could accelerate the rally as inflation keeps the Fed under pressure.


USD Sets Fresh Yearly High as EUR/USD Drops Dramatically, USD/JPY Stable
Well, it was a week of USD strength that wasn’t entirely pushed by USD/JPY, as a strong sell-off in EUR/USD has pushed the major pair to its most oversold state in a decade.

This report is intended for general circulation only. It should not be construed as a recommendation, or an offer (or solicitation of an offer) to buy or sell any financial products. The information provided does not take into account your specific investment objectives, financial situation or particular needs. Before you act on any recommendation that may be contained in this report, independent advice ought to be sought from a financial adviser regarding the suitability of the investment product, taking into account your specific investment objectives, financial situation or particular needs.
StoneX Financial Pte. Ltd., may distribute reports produced by its respective foreign entities or affiliates within the StoneX group of companies or third parties pursuant to an arrangement under Regulation 32C of the Financial Advisers Regulations. Where the report is distributed to a person in Singapore who is not an accredited investor, expert investor or an institutional investor (as defined in the Securities Futures Act), StoneX Financial Pte. Ltd. accepts legal responsibility to such persons for the contents of the report only to the extent required by law. Singapore recipients should contact StoneX Financial Pte. Ltd. at 6826 9988 for matters arising from, or in connection with the report.
In the case of all other recipients of this report, to the extent permitted by applicable laws and regulations neither StoneX Financial Pte. Ltd. nor its associated companies will be responsible or liable for any loss or damage incurred arising out of, or in connection with, any use of the information contained in this report and all such liability is hereby expressly disclaimed. No representation or warranty is made, express or implied, that the content of this report is complete or accurate.
StoneX Financial Pte. Ltd. is not under any obligation to update this report.
Trading CFDs carries a high level of risk that may not be suitable for some investors. Consider your investment objectives, level of experience, financial resources, risk appetite and other relevant circumstances carefully. The possibility exists that you could lose some or all of your investments, including your initial deposits. If in doubt, please seek independent expert advice. Visit www.forex.com/en-sg/terms-and-policies for the complete Risk Disclosure Statement.