


Nikkei 225 Outlook: Record High Tested as Momentum and Positioning Fade
The Nikkei 225 trades near record highs, but fading momentum, softer futures positioning and narrow leadership raise pullback risks.
Share this:

The Nikkei 225 delivered another standout performance in 2025, rising 25% to mark its third consecutive year of gains above 20%. That rally extended the index’s advance from the 2008 low to more than 13,000%, while a wide 72% high-to-low range made it the most volatile year in five.
Whether bulls can repeat that level of exuberance in 2026 remains uncertain. While the Nikkei pushed to fresh record highs on Tuesday, momentum signals are showing early signs of fatigue, suggesting further upside may prove harder to sustain without broader participation.
View related analysis:
View related analysis:
Nikkei 225 Futures (Yen-denominated) – COT positioning
While the Nikkei remains in a strong uptrend and consolidates ahead of its next bullish breakout, net-long exposure to Nikkei futures has begun to wane. The middle panel shows net-long positioning among large speculators (blue line) and asset managers (light-blue histogram) falling in recent weeks, with both cohorts drifting closer to net-short territory.
This shift is largely driven by a reduction in gross long positions, although gross shorts among large speculators have also risen over the past two weeks. While this does not point to an imminent bearish reversal, it is a development worth monitoring as the year progresses.
More immediately, the weekly chart is showing the potential formation of a shooting star at resistance, which could signal near-term exhaustion if confirmed.
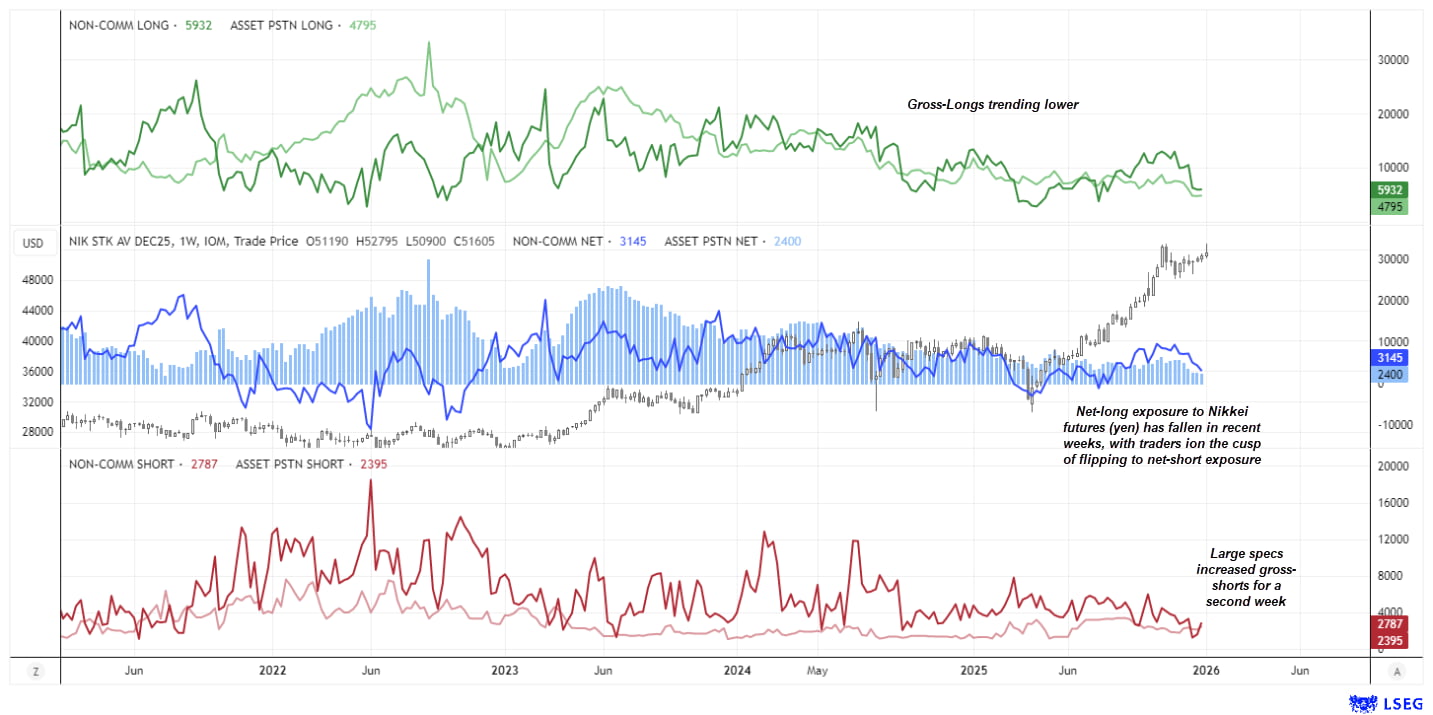
Chart analysis by Matt Simpson - Source: Tokyo Stock Exchange (TSE), CME, LSEG


Nikkei 225, Stock Correlations
The correlation data highlights increasingly narrow leadership within the Nikkei 225, with performance dominated by a small group of high-priced stocks. Fast Retailing and Tokyo Electron remain the most consistent drivers, showing strong correlations across short- and medium-term windows, while semiconductor exposure continues to tie the index closely to global tech sentiment rather than broad market participation.
Short-term correlations have tightened further, suggesting trend strength remains intact but fragile. SoftBank and MUFG have offered intermittent support, but weaker and less stable correlations across the rest of the index point to limited internal breadth, leaving the Nikkei vulnerable should its key leaders lose momentum.

Chart prepared by Matt Simpson - Source: Tokyo Stock Exchange (TSE), LSEG
Nikkei 225 Key Stock Drivers and Risk Signals
Mitsubishi UFJ Financial Group (MUFG) remains the largest Nikkei stock by market capitalisation and continues to trade in a strong uptrend after printing a fresh record high earlier this week. It is difficult to lean bearish on the Nikkei while its most influential heavyweight remains so resilient, suggesting any near-term pullbacks are still likely to be viewed by bulls as opportunities to reload unless a sharp reversal emerges.
SoftBank Group, however, is telling a different story. The Nikkei’s second-largest stock by market cap is carving out a potential bearish continuation pattern on the daily chart, with price set to close back beneath its 20- and 50-day EMAs. This keeps the risk skewed lower, with a move back towards the 4,000 area increasingly plausible near the high-volume node (HVN) of the current consolidation. A break below 3,795 would confirm the next leg lower within its broader bearish daily trend.
Sony Group is showing tentative signs of stabilisation around its 200-day SMA and EMA — levels that often prove difficult to break on first test. Heavy volume accompanied yesterday’s decline into these averages, and today’s inability to push decisively lower may prompt some short covering and allow for a modest bounce. However, unless buying pressure accelerates meaningfully, downside risks remain given the prevailing bearish daily trend and lack of convincing accumulation.
Fast Retailing has been trading sideways in a tight range since December, with Tuesday’s bullish bar failing to break above 58,000 and subsequent price action hinting it may have marked a lower high. While we’ve yet to see strong follow-through from bears, a pickup in volume alongside a renewed price decline could tip the balance in favour of Nikkei bears over the near term and prompt a deeper pullback from the record high set earlier this week.

Chart analysis by Matt Simpson - Source: Tokyo Stock Exchange (TSE), TradingView


Nikkei 225 Futures Technical Analysis
The daily chart shows momentum turning lower for a second consecutive session, although volumes remain lighter than those seen during the rally to record highs. Still, bulls were unable to hold prices at elevated levels for long, leaving recent breakout attempts looking vulnerable as late buyers feel the pressure.
The 51,000 handle and December high now appear to be the next downside focus, with a break below this zone opening the door towards 50,500, where the 20- and 50-day SMAs converge alongside the December VPOC (volume point of control). With MUFG retracing from recent highs and the next three largest Nikkei stocks by market capitalisation failing to show convincing bullish follow-through, the path of least resistance may remain lower into the week, allowing bulls to reassess the potential for another breakout attempt.
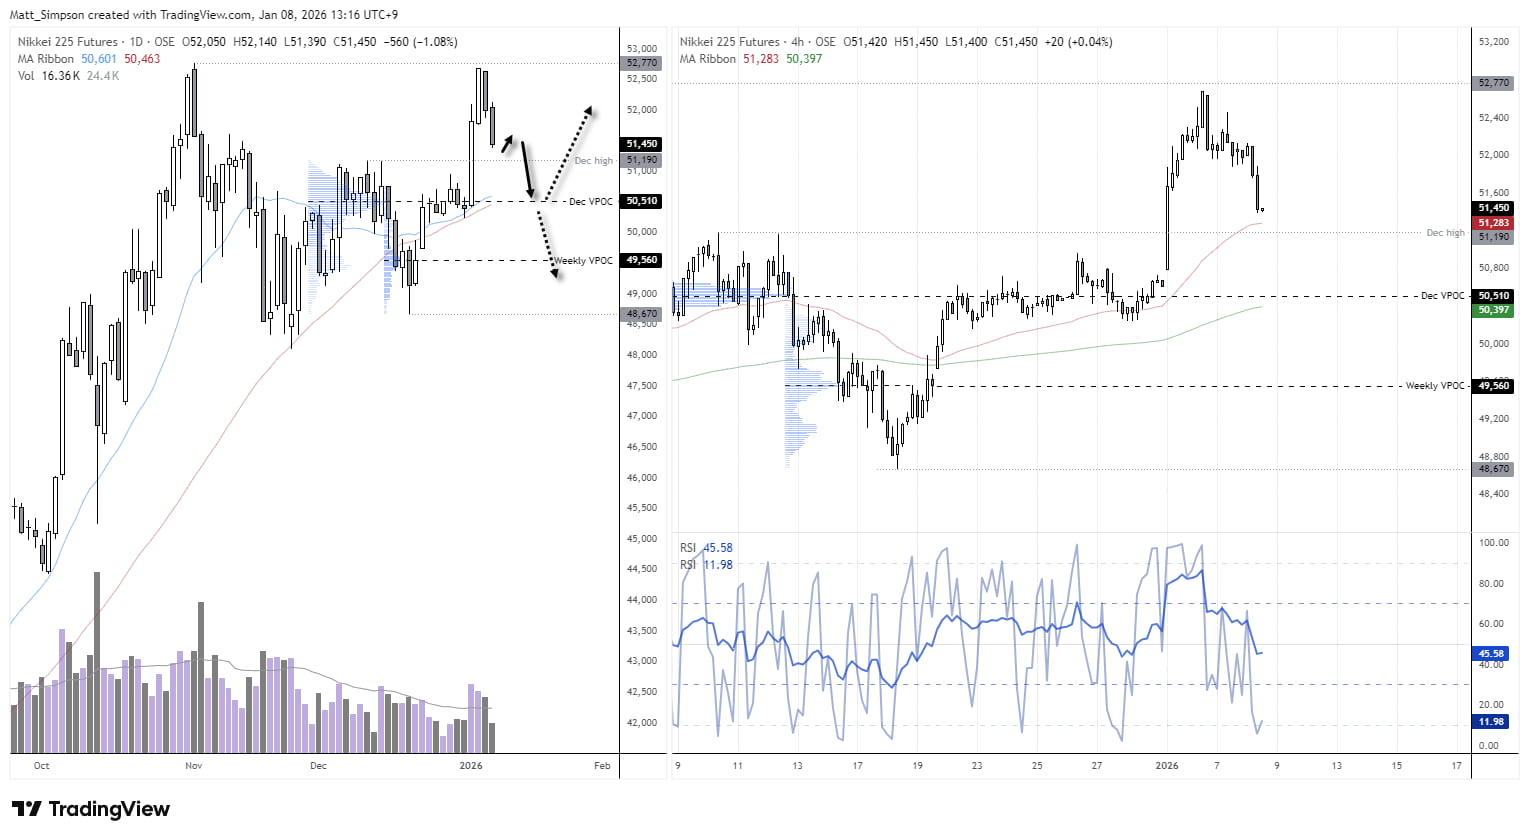
Chart analysis by Matt Simpson - Source: TradingView
View the full economic calendar
View the full economic calendar
-- Written by Matt Simpson
Follow Matt on Twitter @cLeverEdge
How to trade with City Index
You can trade with City Index by following these four easy steps:
- Open an account, or log in if you’re already a customer
• Open an account in the UK
• Open an account in Australia
• Open an account in Singapore
- Search for the market you want to trade in our award-winning platform
- Choose your position and size, and your stop and limit levels
- Place the trade
Related tags:
Latest market news




Open an account in minutes
Experience award-winning platforms with fast and secure execution, and enjoy tight spreads from 0.5 pts on FX and 0.3 pts on indices.
Economic calendar
Web Trader platform
Our sophisticated web-based platform is packed with features.
Related articles
Australian Dollar Outlook: AUD/USD Screams Sentiment Extreme Into Fed, CPI
AUD/USD rebounds despite record bearish futures positioning, with Australian Q3 CPI and the Fed meeting threatening to trigger another short squeeze.
EUR/USD weekly outlook: FOMC and ECB to set the tone
The current backdrop is modestly bearish. On Friday, the EUR/USD closed modestly lower, down for the third consecutive day. The pair also posted a weekly decline after staging a modest recovery attempt in the previous week. Out of the past 8 weeks, the EUR/USD has fallen on 6 occasions. There is not much supporting factors for the single currency right now. So, the upside remains capped.


Silver forecast: metals liquidation drags XAG/USD into $50-55 support
Silver has broken its July low and slipped into a long-term support zone as the selling in precious metals deepens. The chart shows where the metal could bottom, and next week's Fed decision may decide whether it does.
This report is intended for general circulation only. It should not be construed as a recommendation, or an offer (or solicitation of an offer) to buy or sell any financial products. The information provided does not take into account your specific investment objectives, financial situation or particular needs. Before you act on any recommendation that may be contained in this report, independent advice ought to be sought from a financial adviser regarding the suitability of the investment product, taking into account your specific investment objectives, financial situation or particular needs.
StoneX Financial Pte. Ltd., may distribute reports produced by its respective foreign entities or affiliates within the StoneX group of companies or third parties pursuant to an arrangement under Regulation 32C of the Financial Advisers Regulations. Where the report is distributed to a person in Singapore who is not an accredited investor, expert investor or an institutional investor (as defined in the Securities Futures Act), StoneX Financial Pte. Ltd. accepts legal responsibility to such persons for the contents of the report only to the extent required by law. Singapore recipients should contact StoneX Financial Pte. Ltd. at 6826 9988 for matters arising from, or in connection with the report.
In the case of all other recipients of this report, to the extent permitted by applicable laws and regulations neither StoneX Financial Pte. Ltd. nor its associated companies will be responsible or liable for any loss or damage incurred arising out of, or in connection with, any use of the information contained in this report and all such liability is hereby expressly disclaimed. No representation or warranty is made, express or implied, that the content of this report is complete or accurate.
StoneX Financial Pte. Ltd. is not under any obligation to update this report.
Trading CFDs carries a high level of risk that may not be suitable for some investors. Consider your investment objectives, level of experience, financial resources, risk appetite and other relevant circumstances carefully. The possibility exists that you could lose some or all of your investments, including your initial deposits. If in doubt, please seek independent expert advice. Visit www.forex.com/en-sg/terms-and-policies for the complete Risk Disclosure Statement.