




Oil extends losses for a 4th day Is there more downside to come
Oil moves lower for a fourth day as COVID cases and China slowing growth concerns weigh. OPEC+ don't see the need for additional output in H2 beyond that already agreed.
Share this:

Crude oil extends losses
Crude oil remains under pressure, extending losses for a fourth straight day. Oil trades down around 10% so far this month after gaining around 40% in the first 6 months of the year.
Whilst optimism surrounding the demand outlook drove oil prices higher across the first half of the year concerns over rising delta cases and the slowing economic recovery in China, the world’s second largest consumer of oil. After a stellar first half, oil is looking vulnerable.
Chinese retail sales and industrial production were softer than expected on Monday, highlighting the impact that tougher covid restrictions are having on the Chinese economy. Adding pressure to oil prices, Chinese oil demand slumped 2.3% as daily crude processing in July fell to its lowest level since May 2020.
Covid cases are on the rise in China, where pandemic restrictions have been tightened. Japan is also set to extend its state of emergency widen restrictions to include more prefectures whilst cases were also substantially higher in Australia.
Offering some support to oil prices were comments from OPEC+ yesterday. In response to US President Biden’s call for further output, OPEC+ said that they do not consider that additional supply, above the already agreed increase of 400,000 bpd, was necessary in the second half of the year.
Where next for crude oil prices?
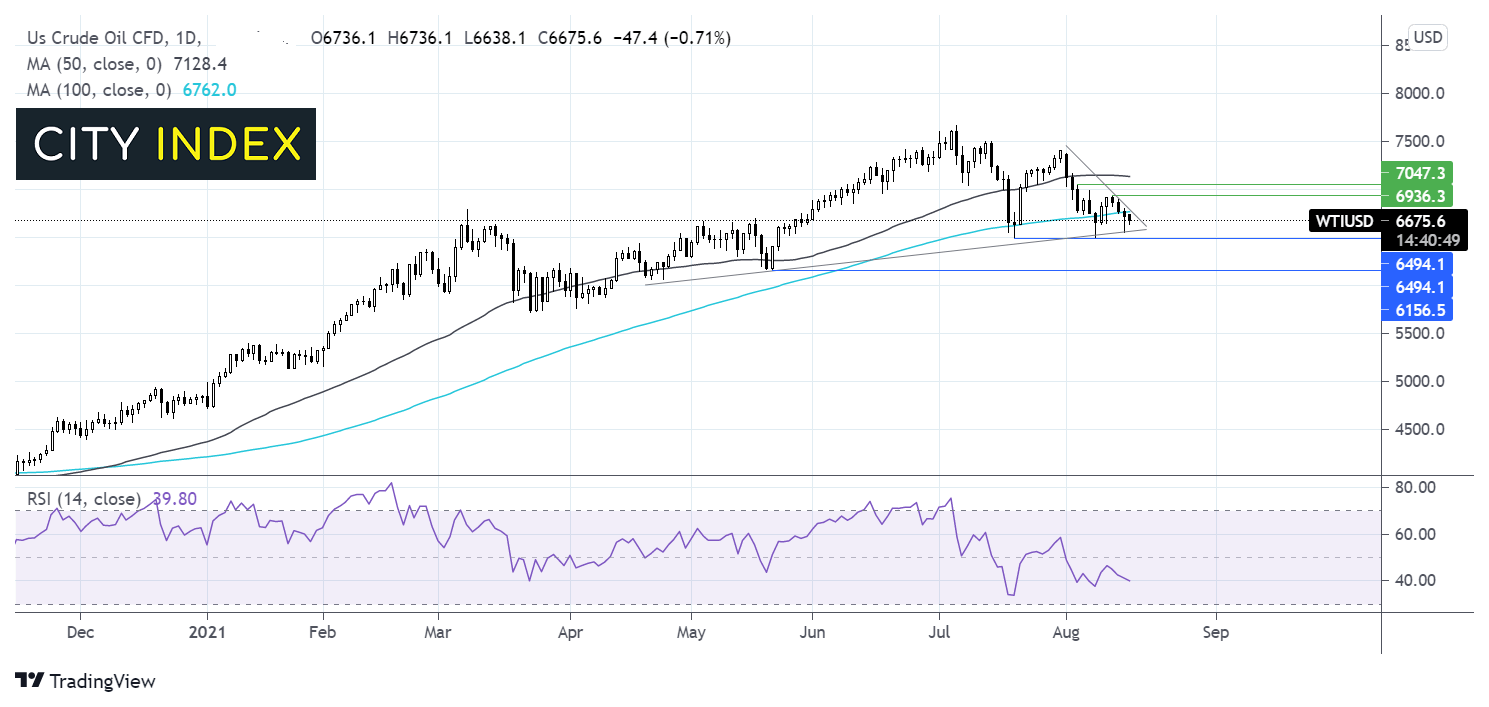
WTI crude oil trades lower for a 4th day. A close below the 100 dma combined with the RSI in negative territory and pointing lower suggests that there could be more downside to come.
Sellers will need to break below the rising trendline support at 65.70 in order to test support at 65.00 the July low. 61.50 the May could also offer support.
On the upside, buyers need to close above the 100 dma and descending trendline resistance which could prove to be a tough nut to crack. Beyond here, 69.30 last week’s high and 70.30 the August 4 high could offer some resistance.
How to trade with FOREX.com
Follow these easy steps to start trading with FOREX.com today:
- Open a Forex.com account, or log-in if you’re already a customer.
- Search for the market you want to trade in our award-winning platform.
- Choose your position and size, and your stop and limit levels.
- Place the trade.
Crude oil extends losses
Crude oil remains under pressure, extending losses for a fourth straight day. Oil trades down around 10% so far this month after gaining around 40% in the first 6 months of the year.
Whilst optimism surrounding the demand outlook drove oil prices higher across the first half of the year concerns over rising delta cases and the slowing economic recovery in China, the world’s second largest consumer of oil. After a stellar first half, oil is looking vulnerable.
Chinese retail sales and industrial production were softer than expected on Monday, highlighting the impact that tougher covid restrictions are having on the Chinese economy. Adding pressure to oil prices, Chinese oil demand slumped 2.3% as daily crude processing in July fell to its lowest level since May 2020.
Covid cases are on the rise in China, where pandemic restrictions have been tightened. Japan is also set to extend its state of emergency widen restrictions to include more prefectures whilst cases were also substantially higher in Australia.
Offering some support to oil prices were comments from OPEC+ yesterday. In response to US President Biden’s call for further output, OPEC+ said that they do not consider that additional supply, above the already agreed increase of 400,000 bpd, was necessary in the second half of the year.
Where next for crude oil prices?
WTI crude oil trades lower for a 4th day. A close below the 100 dma combined with the RSI in negative territory and pointing lower suggests that there could be more downside to come.
Sellers will need to break below the rising trendline support at 65.70 in order to test support at 65.00 the July low. 61.50 the May could also offer support.
On the upside, buyers need to close above the 100 dma and descending trendline resistance which could prove to be a tough nut to crack. Beyond here, 69.30 last week’s high and 70.30 the August 4 high could offer some resistance.
How to trade with City Index
Follow these easy steps to start trading with City Index today:
- Open a City Index account, or log-in if you’re already a customer.
- Search for the market you want to trade in our award-winning platform.
- Choose your position and size, and your stop and limit levels
- Place the trade.
Related tags:




Open an account in minutes
Experience award-winning platforms with fast and secure execution, and enjoy tight spreads from 0.5 pts on FX and 0.3 pts on indices.
Economic calendar
Web Trader platform
Our sophisticated web-based platform is packed with features.
Related articles

Dow Jones Forecast: DJIA rises after weaker jobs data
U.S. stocks are rising after weaker-than-expected U.S. jobs data saw markets rein in rate hike expectations.

Nasdaq 100 Forecast: NDX slips as Treasury yields keep rising
U.S. stocks are falling at the start of Q4, as gains in software stocks offset concerns over soaring Treasury yields. U.S. Treasury yields continue to rise, with the 10-year yield up 2 basis points at 5.31% and the 30-year at 5.66%, multi-decade highs.

S&P 500 Forecast: SPX rises after cooler-than-expected inflation data
U.S. stocks are rising and Treasury yields are falling after data showed that inflation increased at a cooler pace than expected, while U.S. consumer spending rose again in August.
This report is intended for general circulation only. It should not be construed as a recommendation, or an offer (or solicitation of an offer) to buy or sell any financial products. The information provided does not take into account your specific investment objectives, financial situation or particular needs. Before you act on any recommendation that may be contained in this report, independent advice ought to be sought from a financial adviser regarding the suitability of the investment product, taking into account your specific investment objectives, financial situation or particular needs.
StoneX Financial Pte. Ltd., may distribute reports produced by its respective foreign entities or affiliates within the StoneX group of companies or third parties pursuant to an arrangement under Regulation 32C of the Financial Advisers Regulations. Where the report is distributed to a person in Singapore who is not an accredited investor, expert investor or an institutional investor (as defined in the Securities Futures Act), StoneX Financial Pte. Ltd. accepts legal responsibility to such persons for the contents of the report only to the extent required by law. Singapore recipients should contact StoneX Financial Pte. Ltd. at 6826 9988 for matters arising from, or in connection with the report.
In the case of all other recipients of this report, to the extent permitted by applicable laws and regulations neither StoneX Financial Pte. Ltd. nor its associated companies will be responsible or liable for any loss or damage incurred arising out of, or in connection with, any use of the information contained in this report and all such liability is hereby expressly disclaimed. No representation or warranty is made, express or implied, that the content of this report is complete or accurate.
StoneX Financial Pte. Ltd. is not under any obligation to update this report.
Trading CFDs carries a high level of risk that may not be suitable for some investors. Consider your investment objectives, level of experience, financial resources, risk appetite and other relevant circumstances carefully. The possibility exists that you could lose some or all of your investments, including your initial deposits. If in doubt, please seek independent expert advice. Visit www.forex.com/en-sg/terms-and-policies for the complete Risk Disclosure Statement.