


S&P 500, Nasdaq 100 Forecast for Next Week: Is This It?
The Trump Pump has continued for much of the past three months but the focus for next week shifts to revenue potential from AI and tech leadership with Google and Tesla reporting earnings next Wednesday.
Share this:

S&P 500, Nasdaq 100 Talking Points:
- Coming into this year my forecast for US equities was bullish, looking for an alignment of fiscal and monetary policy as President Trump was set to continue to pump markets in a unique way.
- My target for SPX was 7500 and that’s already been met, and that’s around where problems have started to show. The big question now is whether a larger pullback may be before us.
- Next week ushers in the start of tech earnings and Matt Weller previewed that in his Mag Seven Earnings Preview.

They say that bull markets don’t die of old age, and this is true although possibly misleading. Because with age comes deployed capital and higher degrees of leverage, and as long as there’s not a reason for change that’s something that can go on and on. But opportunity cost, however, can be a massive determinant as to whether trends begin to turn and at some point, anyone willing and able to be long already is, and a lack of dry capital on the sidelines could bring with it a reason for change.
Since President Trump’s inauguration of his second term there’s been two sizable pullback scenarios, and each turned out to be an epic buying opportunity. But even before that, the Fed’s rate hike cycle in 2022 was a catalyst for change that held for much of that year. The response to that was another epic rally that lasted for years and that’s when the AI trade began to take over.
To be sure, there are multiple parallels between the AI boom and the tech boom of the late 90’s: I wrote about this in my yearly forecasts for stocks both in 2025 and 2026. But, as I said in each, a sample size of one isn’t reason to draw conclusions and there was enough nuance and difference in those situations to avoid getting too confident of a single sample turning into something more.
With that said, one of the big differences between the periods was revenue potential as the AI build out has brought earnings to companies like NVDA while the tech boom was more hope-driven with a lack of underlying growth. That theme is front-and-center next week when bellwether Google reports earnings on Wednesday and this can have an outsized impact on the matter.
From an interest rate perspective, with persistent inflation in the US it looks as though the Fed continues to lean more towards hikes rather than cuts later in the year and if we do see disappointment in stocks, that could lead to pullback potential. Longer-term, at least at this point, that could be seen as opportunistic, similar to the earlier-year sell-off on the back of the Iran conflict or last year’s episode around the tariff tantrum.
SPX
For the past almost two months the S&P 500 has consolidated within an ascending triangle pattern. This is horizontal support to go along with higher-lows and this is a formation that’s often approached with bullish aim as the increasing optimism shown from buyers at the higher-lows can, eventually, lead to a topside break of the horizontal resistance that they haven’t yet been able to take out.
This contrasts nicely with the formation looked at below in the Nasdaq, and if one wanted to take a bearish stance on equities that would seem a more logical place to do it. In SPX, given the ascending triangle this keeps the door open to bullish breakout potential and if we do get a larger pullback, it’s the area around 6983-7k that stands out for support potential, as this is a prior swing high that coincides with the 50% retracement of the 2026 rally.
S&P 500 Weekly Chart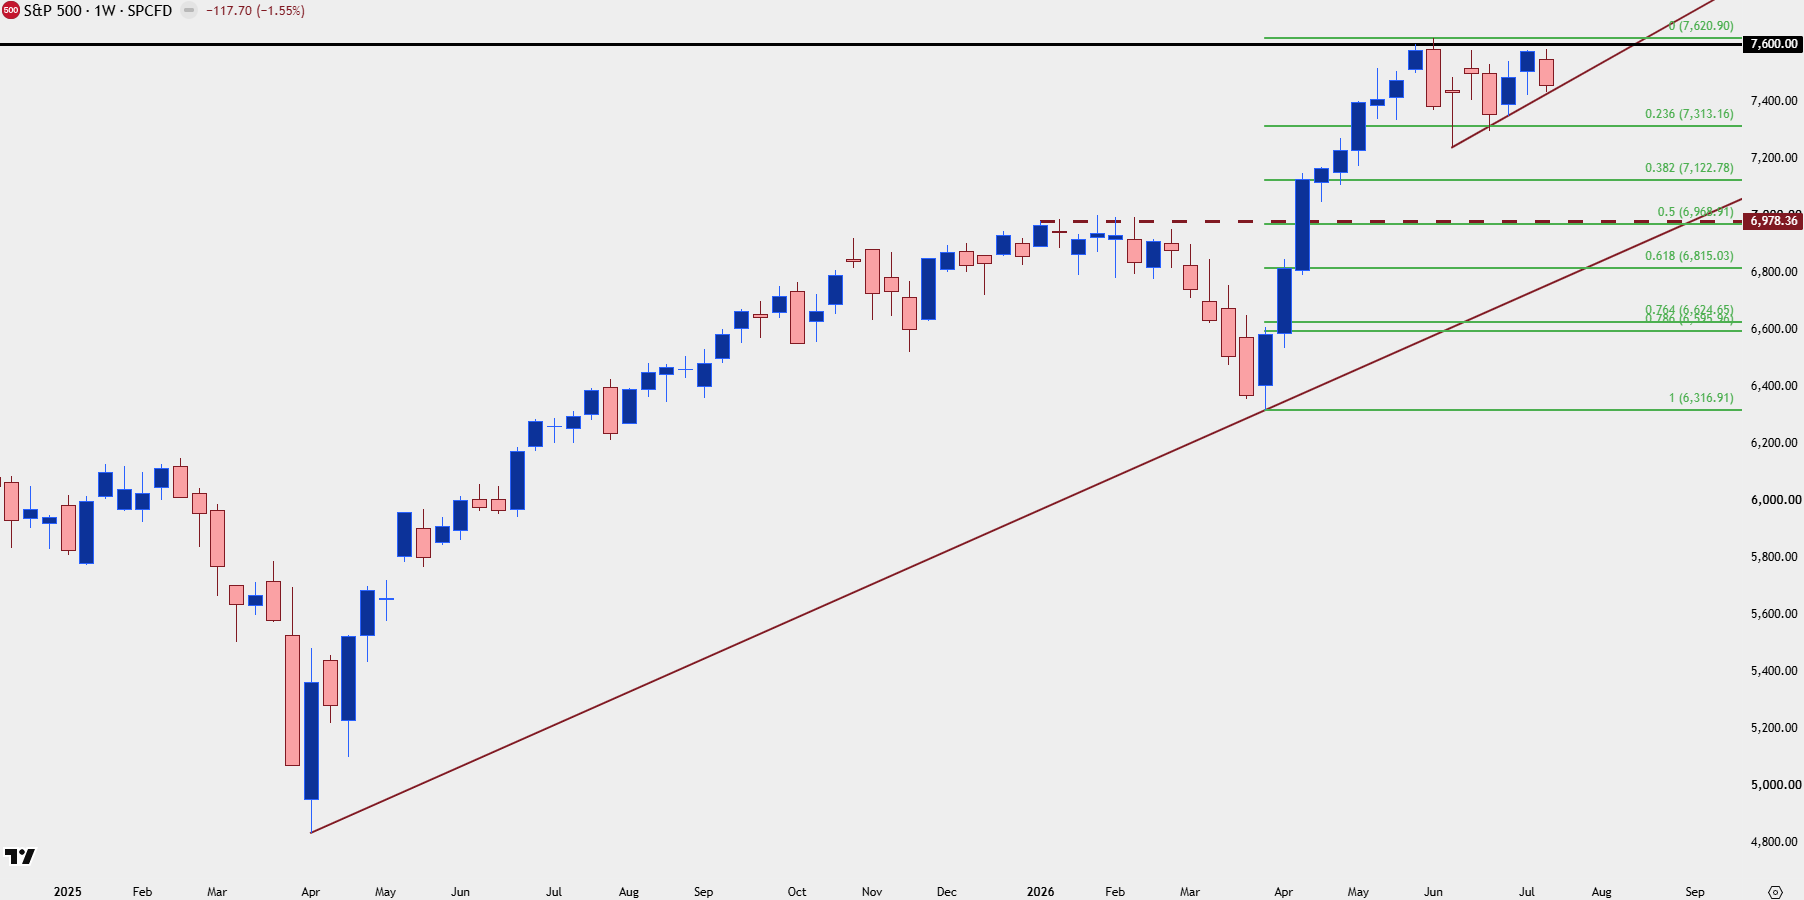
Chart prepared by James Stanley; data derived from Tradingview
Nasdaq 100
While there’s an ascending triangle in-play on SPX above, the Nasdaq 100 is showing an opposing version of that formation with a descending triangle, which is often approached with aim of bearish breakdown potential.
Current support has held around the 28,400 level but the lower-highs posting since late June indicate sellers getting more aggressive on fading bounces. And given how strongly tech stocks ripped earlier in the year on the back of the Q2 turn, there’s not much for support potential for a couple thousand points below that marker.
If we do get down to that 26,400 area, I think that could again be looked at as a buying opportunity especially if that price comes into play quickly, as short-term oversold readings could bring on a push to fade the sell-off.
But for those that do want to take a bearish stance on equities this backdrop seems more accommodative for such than the S&P 500 looked at above, and for those that want to press bullish themes, SPX and the ascending triangle make for a more logical argument on that end.
Nasdaq 100 Futures (NQ) Daily Chart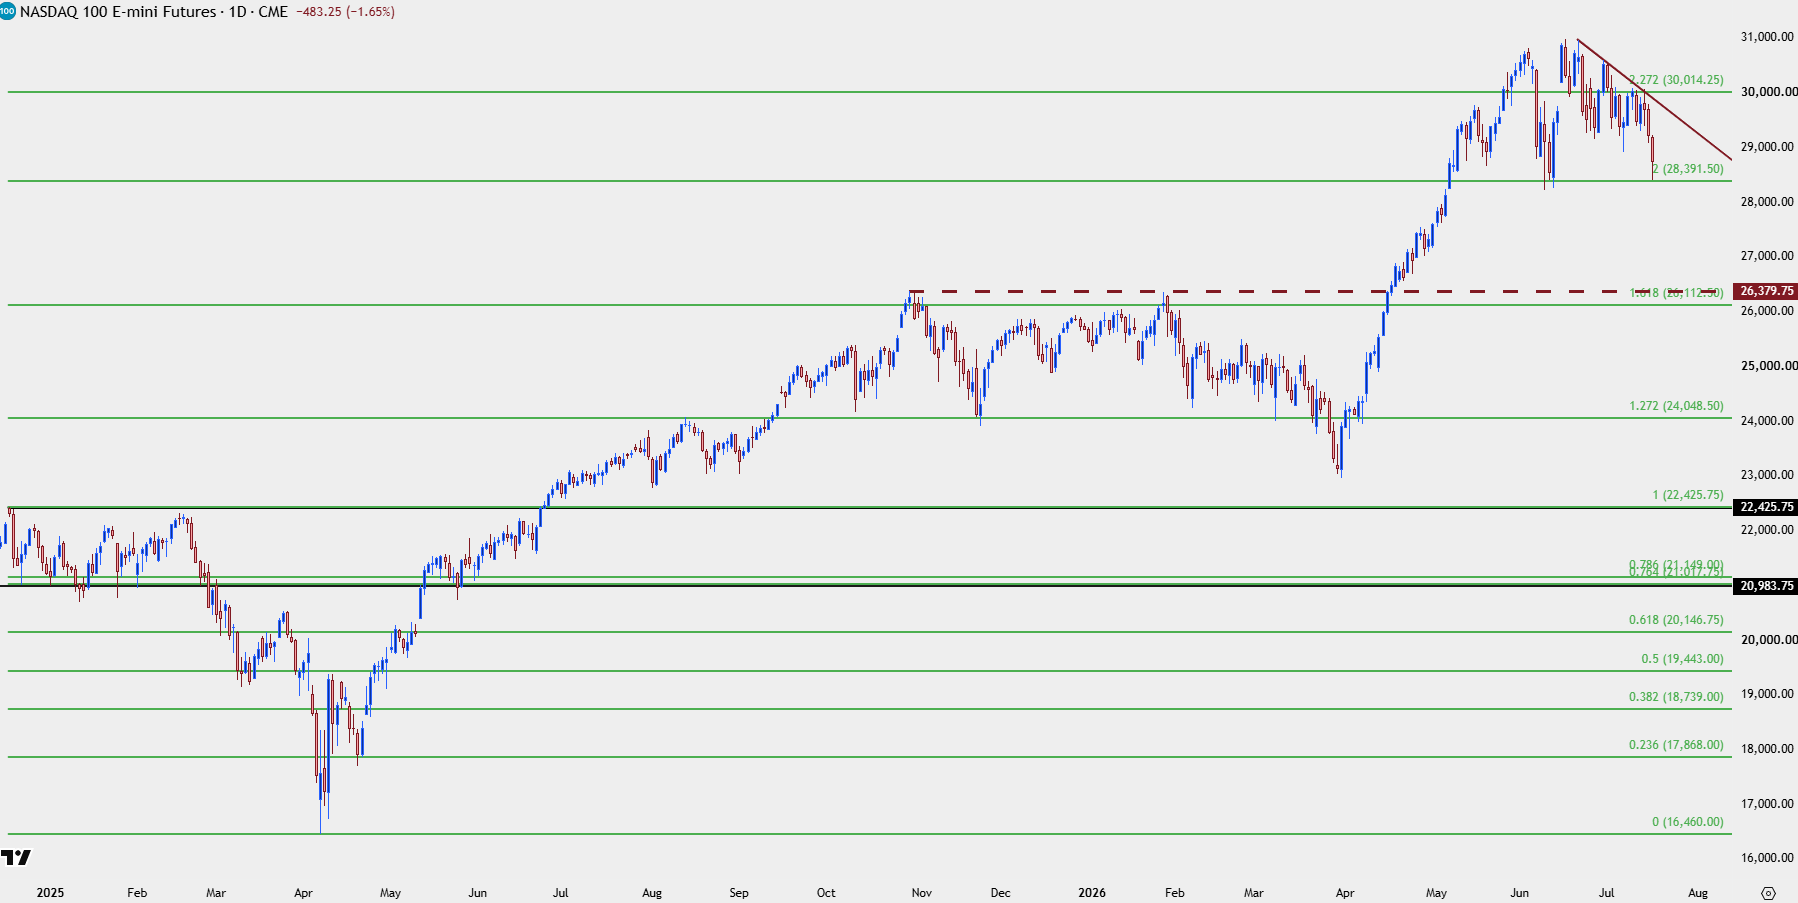
Chart prepared by James Stanley; data derived from Tradingview
--- written by James Stanley, Senior Market Analyst, Global Macro
Related tags:
Latest market news




Open an account in minutes
Experience award-winning platforms with fast and secure execution, and enjoy tight spreads from 0.5 pts on FX and 0.3 pts on indices.
Economic calendar
Web Trader platform
Our sophisticated web-based platform is packed with features.
Related articles
USD into a Massive Week as Yields Fly and Gold Breaks
It’s a huge week with PCE and NFP, but it’s what’s happening off of the calendar that demands attention with US yields flying to fresh multi-decade highs.
Nasdaq 100 Forecast: NDX falls as oil jumps and Treasury yields rise
U.S. stocks are pointing to a weaker open on Monday after President Trump rejected an Iranian ceasefire, sending oil prices higher and fuelling inflationary concerns and pushing Treasury yields higher.


S&P 500, Nasdaq, Dow Forecast: Wall Street Split Widens Into Month-End 9 26 2026
Nasdaq strength contrasts with mounting Dow pressure as rising Treasury yields raise the stakes for stocks heading into the monthly close.

This report is intended for general circulation only. It should not be construed as a recommendation, or an offer (or solicitation of an offer) to buy or sell any financial products. The information provided does not take into account your specific investment objectives, financial situation or particular needs. Before you act on any recommendation that may be contained in this report, independent advice ought to be sought from a financial adviser regarding the suitability of the investment product, taking into account your specific investment objectives, financial situation or particular needs.
StoneX Financial Pte. Ltd., may distribute reports produced by its respective foreign entities or affiliates within the StoneX group of companies or third parties pursuant to an arrangement under Regulation 32C of the Financial Advisers Regulations. Where the report is distributed to a person in Singapore who is not an accredited investor, expert investor or an institutional investor (as defined in the Securities Futures Act), StoneX Financial Pte. Ltd. accepts legal responsibility to such persons for the contents of the report only to the extent required by law. Singapore recipients should contact StoneX Financial Pte. Ltd. at 6826 9988 for matters arising from, or in connection with the report.
In the case of all other recipients of this report, to the extent permitted by applicable laws and regulations neither StoneX Financial Pte. Ltd. nor its associated companies will be responsible or liable for any loss or damage incurred arising out of, or in connection with, any use of the information contained in this report and all such liability is hereby expressly disclaimed. No representation or warranty is made, express or implied, that the content of this report is complete or accurate.
StoneX Financial Pte. Ltd. is not under any obligation to update this report.
Trading CFDs carries a high level of risk that may not be suitable for some investors. Consider your investment objectives, level of experience, financial resources, risk appetite and other relevant circumstances carefully. The possibility exists that you could lose some or all of your investments, including your initial deposits. If in doubt, please seek independent expert advice. Visit www.forex.com/en-sg/terms-and-policies for the complete Risk Disclosure Statement.