




S&P 500, Nikkei 225 analysis: Can someone let the dead cat bounce out?
US bond yields pulled back to give risk assets a reprieve from their selloff on Wednesday. But with bond market implied volatility also pulling back, perhaps there's a little more room for a bounce for the Nikkei and S&P 500.
Share this:
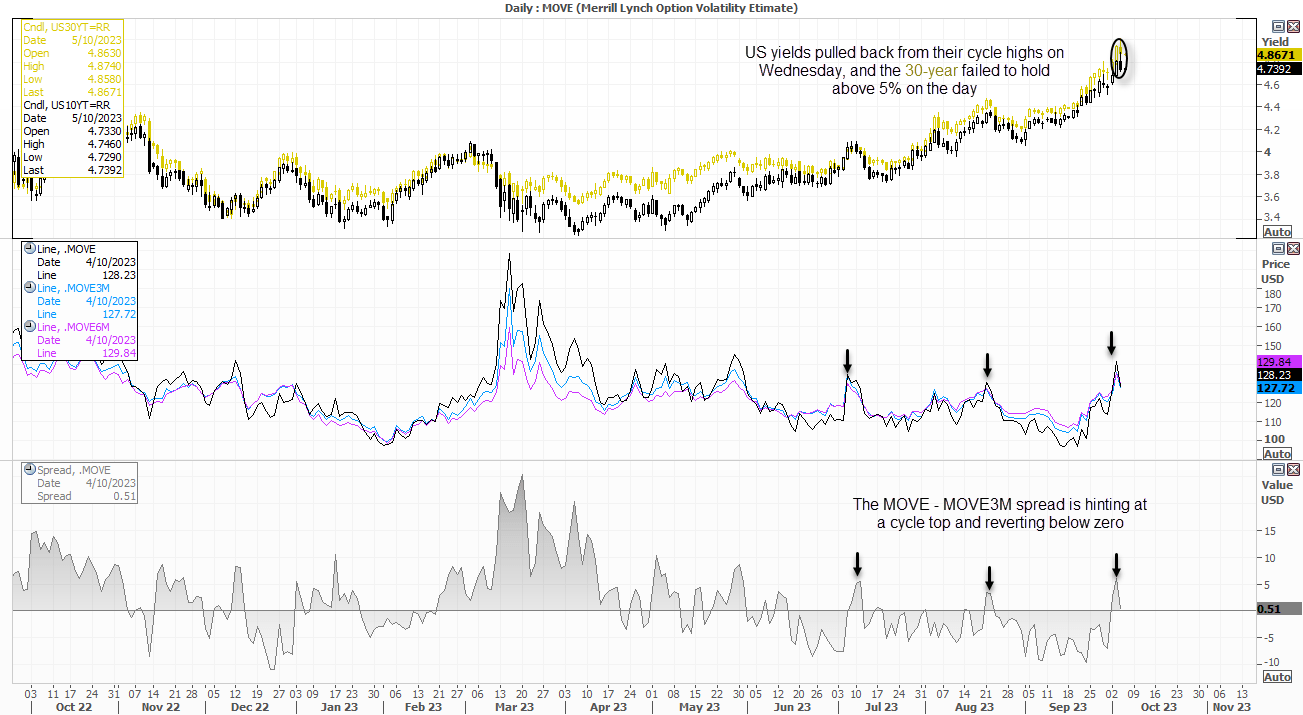
The rise in yields due to the bond selloff has received much coverage in recent weeks, and any attempt to pick the top in yields has burned many fingers along the way. But when multiple markets provide clues at the same time, it can point towards an inflection point – even if only short lived.
On Wednesday we saw US yields pull back across the curve from multi-year highs, which allowed currencies to drag themselves from their lows along with stock market indices. The bounces were mild and in no means a white flag from bears, and merely a reprieve from the selloff if anything. But perhaps there may be some more juice in the tank for risk if the retracement on the bond markets extends for another day or two.
A measure of implied volatility for bond markets also retraced lower with yields, with the MOVE index for the 30-day, 3-month and 6-month all tracking the VIX lower. The 30-day MOVE index is also on the cup of retreating below the 3-month MOVE, which means implied volatility could soon be expected to be less over the next month than over the next three (and is where we would usually expect to find it). The 30-year yield also failed to hold above 5% on the day, suggesting profit taking from bears who were short the market.
And with near-record level of futures traders net-short bonds, profit taking may not be the worst idea in the world once in a while. This may not be the end of the trend given the increased supply of bonds and ‘higher for longer’ Fed narrative, but we may be at or close to a near-term inflection point that could allow risk to bounce a tad here or there.
Nikkei 224 futures technical analysis (daily chart)
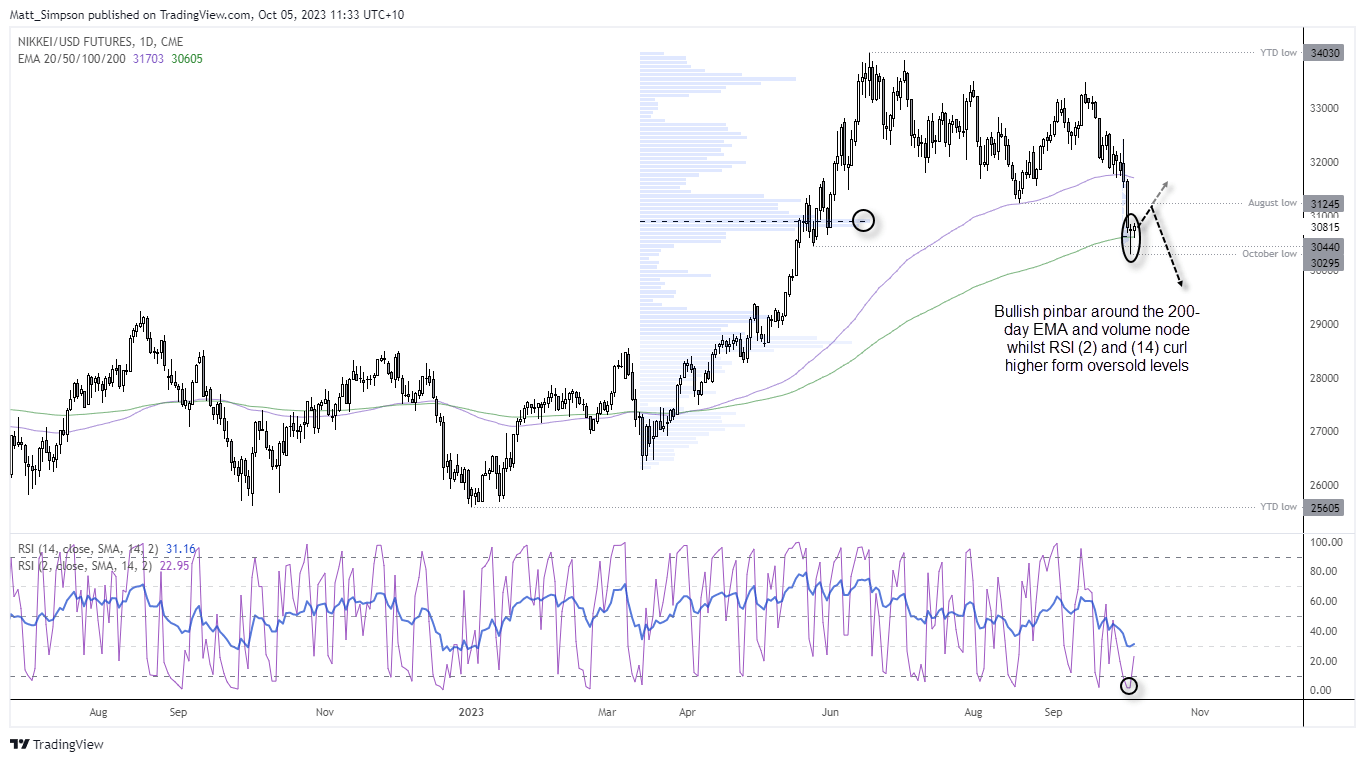
The Nikkei fell nearly -10% form the September high, before the 200-day EMA came to the rescue. Prices are also trading around a volume ledge left during the March to June rally, so some bulls may be defending these levels. Furthermore, the RSI (2) and RSI (14) reached their respective oversold levels on Tuesday and have since curled higher to hint at a near-term trough, and the market formed a small bullish pinbar on Wednesday.
From here, I’m cautiously bullish whilst prices remain above the 200-day EMA and for a retest of 34,000,
S&P 500 E-mini futures technical analysis (daily chart)
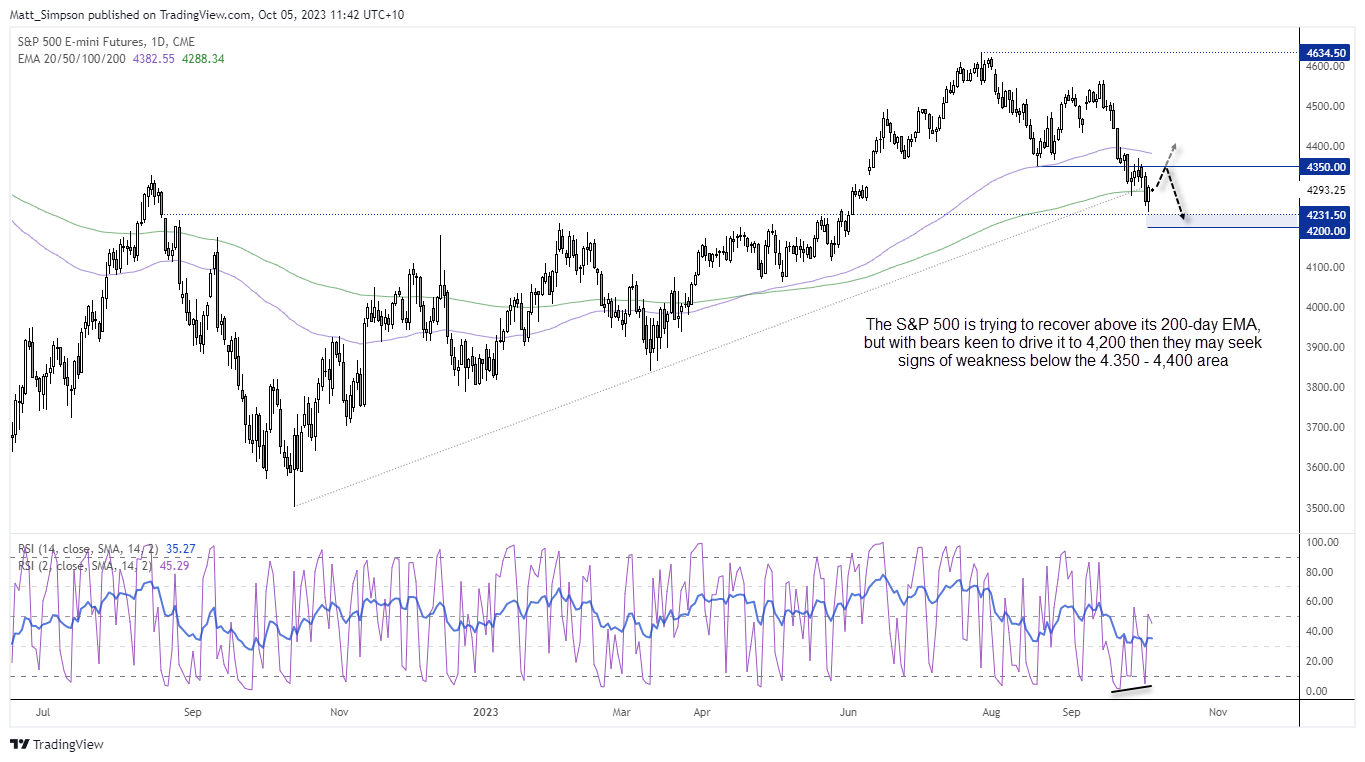
I also see the potential for a bounce on the S&P 500, given it also bounced back above its 200-day EMA. A bullish divergence formed on the RSI (2) and RSI (14) has curled higher from oversold. Wednesday’s lows also held above 4,200, although as of yet we’re yet to see a break above 4,300. The issue I have with this index is the reward to risk seems undesirable being below 4,350 resistance, which is why intraday trade would be preferred until we get more clarity on its next direction. But 4,200 seems like a viable target for bears should yields rip higher, and that could make the 4,350 area tempting for bears to fade into, should we get a small dead-cat bounce.
-- Written by Matt Simpson
Follow Matt on Twitter @cLeverEdge
How to trade with City Index
You can trade with City Index by following these four easy steps:
- Open an account, or log in if you’re already a customer
• Open an account in the UK
• Open an account in Australia
• Open an account in Singapore
- Search for the market you want to trade in our award-winning platform
- Choose your position and size, and your stop and limit levels
- Place the trade

Open an account in minutes
Experience award-winning platforms with fast and secure execution, and enjoy tight spreads from 0.5 pts on FX and 0.3 pts on indices.
Economic calendar
Web Trader platform
Our sophisticated web-based platform is packed with features.
Related articles

Gold Update: XAU/USD Remains Under Pressure Even After the NFP Report
As the trading week comes to an end, weakness around gold price action remains evident in the short term. This can be seen in the performance of the past two sessions, where the metal has declined by approximately 0.3%. Although the move has not been particularly aggressive, it highlights that buying pressure continues to struggle to regain control of the market.


USD/CAD forecast: rally could accelerate above June highs at 1.4250
USD/CAD recovered quickly after weaker US jobs data, keeping the bullish trend in focus. A move above the June highs could accelerate the rally as inflation keeps the Fed under pressure.


Dow Jones Slide Shows What Rate Hike Bets Mean for Stocks
The Dow Jones support breakdown shows rising bond yields and rate hike bets hitting U.S. stocks while tech giants prop up the Nasdaq.
This report is intended for general circulation only. It should not be construed as a recommendation, or an offer (or solicitation of an offer) to buy or sell any financial products. The information provided does not take into account your specific investment objectives, financial situation or particular needs. Before you act on any recommendation that may be contained in this report, independent advice ought to be sought from a financial adviser regarding the suitability of the investment product, taking into account your specific investment objectives, financial situation or particular needs.
StoneX Financial Pte. Ltd., may distribute reports produced by its respective foreign entities or affiliates within the StoneX group of companies or third parties pursuant to an arrangement under Regulation 32C of the Financial Advisers Regulations. Where the report is distributed to a person in Singapore who is not an accredited investor, expert investor or an institutional investor (as defined in the Securities Futures Act), StoneX Financial Pte. Ltd. accepts legal responsibility to such persons for the contents of the report only to the extent required by law. Singapore recipients should contact StoneX Financial Pte. Ltd. at 6826 9988 for matters arising from, or in connection with the report.
In the case of all other recipients of this report, to the extent permitted by applicable laws and regulations neither StoneX Financial Pte. Ltd. nor its associated companies will be responsible or liable for any loss or damage incurred arising out of, or in connection with, any use of the information contained in this report and all such liability is hereby expressly disclaimed. No representation or warranty is made, express or implied, that the content of this report is complete or accurate.
StoneX Financial Pte. Ltd. is not under any obligation to update this report.
Trading CFDs carries a high level of risk that may not be suitable for some investors. Consider your investment objectives, level of experience, financial resources, risk appetite and other relevant circumstances carefully. The possibility exists that you could lose some or all of your investments, including your initial deposits. If in doubt, please seek independent expert advice. Visit www.forex.com/en-sg/terms-and-policies for the complete Risk Disclosure Statement.