



Stocks Rally After the Rate Hike but is a Lagging Nasdaq Saying Something?
The response to the rate hike was a strong Thursday outing but ever since Kevin Warsh took over atop the Fed there’s been a shift in equity markets.
Share this:

S&P 500, Nasdaq Talking Points:
- At this point stocks are still in a bullish state, and that can remain the case into Q4 as we head into mid-term elections. But the leader has become a laggard and that has to be taken into account as a higher rate regime can drive a shift in US equities.
- Perhaps more disconcerting is the deduction that companies like NVDA haven’t set all-time-highs in months despite stellar earnings and guidance.
- If US Treasury rates do continue higher, this could, eventually, spell opportunity cost and drive capital away from stocks and into bonds, something that hasn’t really been the case since the lead-in to the financial collapse back in 2006 and 2007.
This content was created by an affiliate of FOREX.com and represents the views and opinions of the author/speakers, not the views and opinions of Forex.com, StoneX Group Inc., or its subsidiaries. The content has not been independently reviewed by FOREX.com.
Forecasting bullish equities has seemingly been a pretty simple call for much of the past 15 years. Sure, there have been a few periods of retracement but, by and large, ever since the Fed figured out they could build a balance sheet and suppress bond yields, thereby driving capital into riskier asset classes such as stocks, bulls have enjoyed one of the brightest backdrops that they’ve ever had in long equities.
Along the way ‘the wealth effect’ seemed to be embraced by the Fed, which states that stronger equity markets drive higher levels of consumer spending, thereby putting the wind to the sails of the central bank’s actions, which makes sense.
This is one of the reasons for the outperformance in technology stocks, as an abundance of capital has pushed into research and development, driving valuations ever-higher; and if there’s little opportunity cost for investors and markets keep humming along, there’s little cause for concern.
More recently, however, a shift has shown, and that’s perhaps ironically taken place as President Trump’s hand-picked successor at the Fed has taken over in a manner much more hawkish than what many were expecting. Warsh has talked a tough game on inflation, and last week he showed up with a rate hike in his first move atop the bank. He also highlighted another move on the horizon, despite his apparent discomfort with forecasts. And while stocks initially sold off, very similar to the July meeting, support soon showed and buyers took over in a big way on the Thursday after the rate decision.
As I looked at coming into this week, there remains a bullish backdrop in the S&P 500 as there’s both a bull flag and a support hit at the 50% mark of the recent major move, the rally that pushed after the July rate decision.
S&P 500 Futures – Daily Chart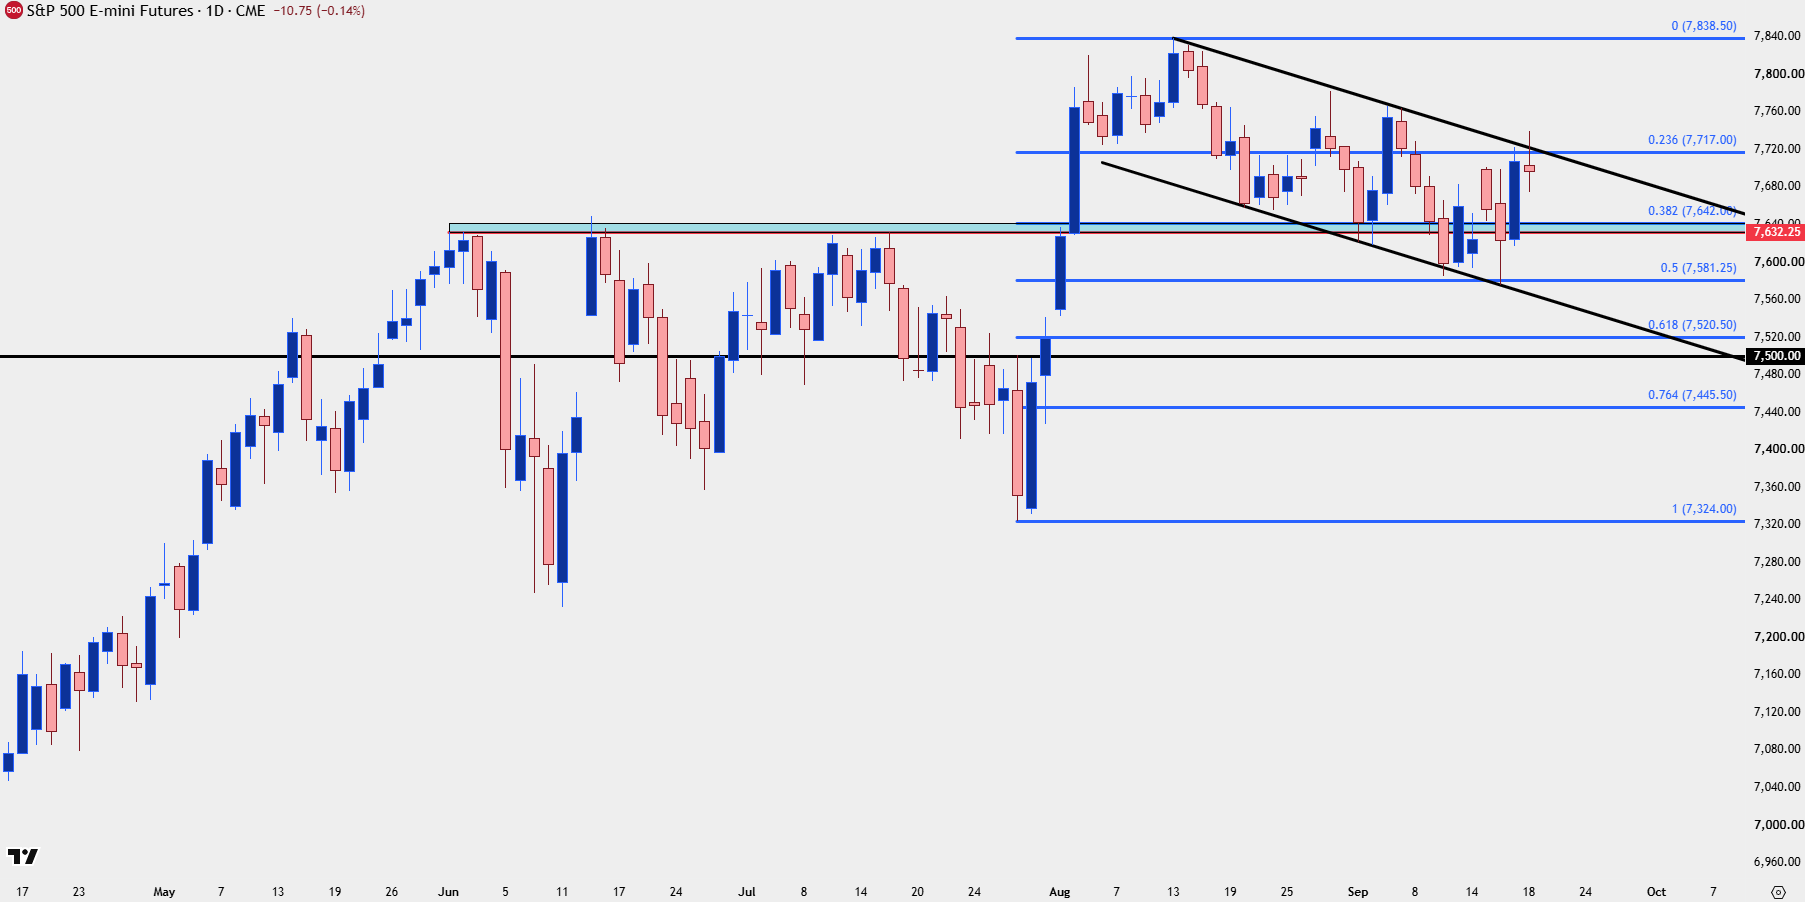
Chart prepared by James Stanley; data derived from Tradingview
Nasdaq
That bullish enthusiasm hasn’t shown to the same degree everywhere. And since the day before Kevin Warsh’s first rate decision at the Fed, the Nasdaq 100 has not set a fresh ATH. The series of lower-highs has remained at a descending trendline, and, to be completely balanced, this can be argued as an inverse head and shoulders formation which can have bullish potential – provided that the neckline, in this case the trendline, gets broken with an upward push. So, bulls still have hope here – but the fact that they haven’t pushed up to fresh highs even as the S&P 500 has, is something that traders should take note of. Because when the leaders become the laggard, there’s often a shift under the surface that can turn into something larger.
There was a similar case back in the year 2000.
Nasdaq 100 Daily Chart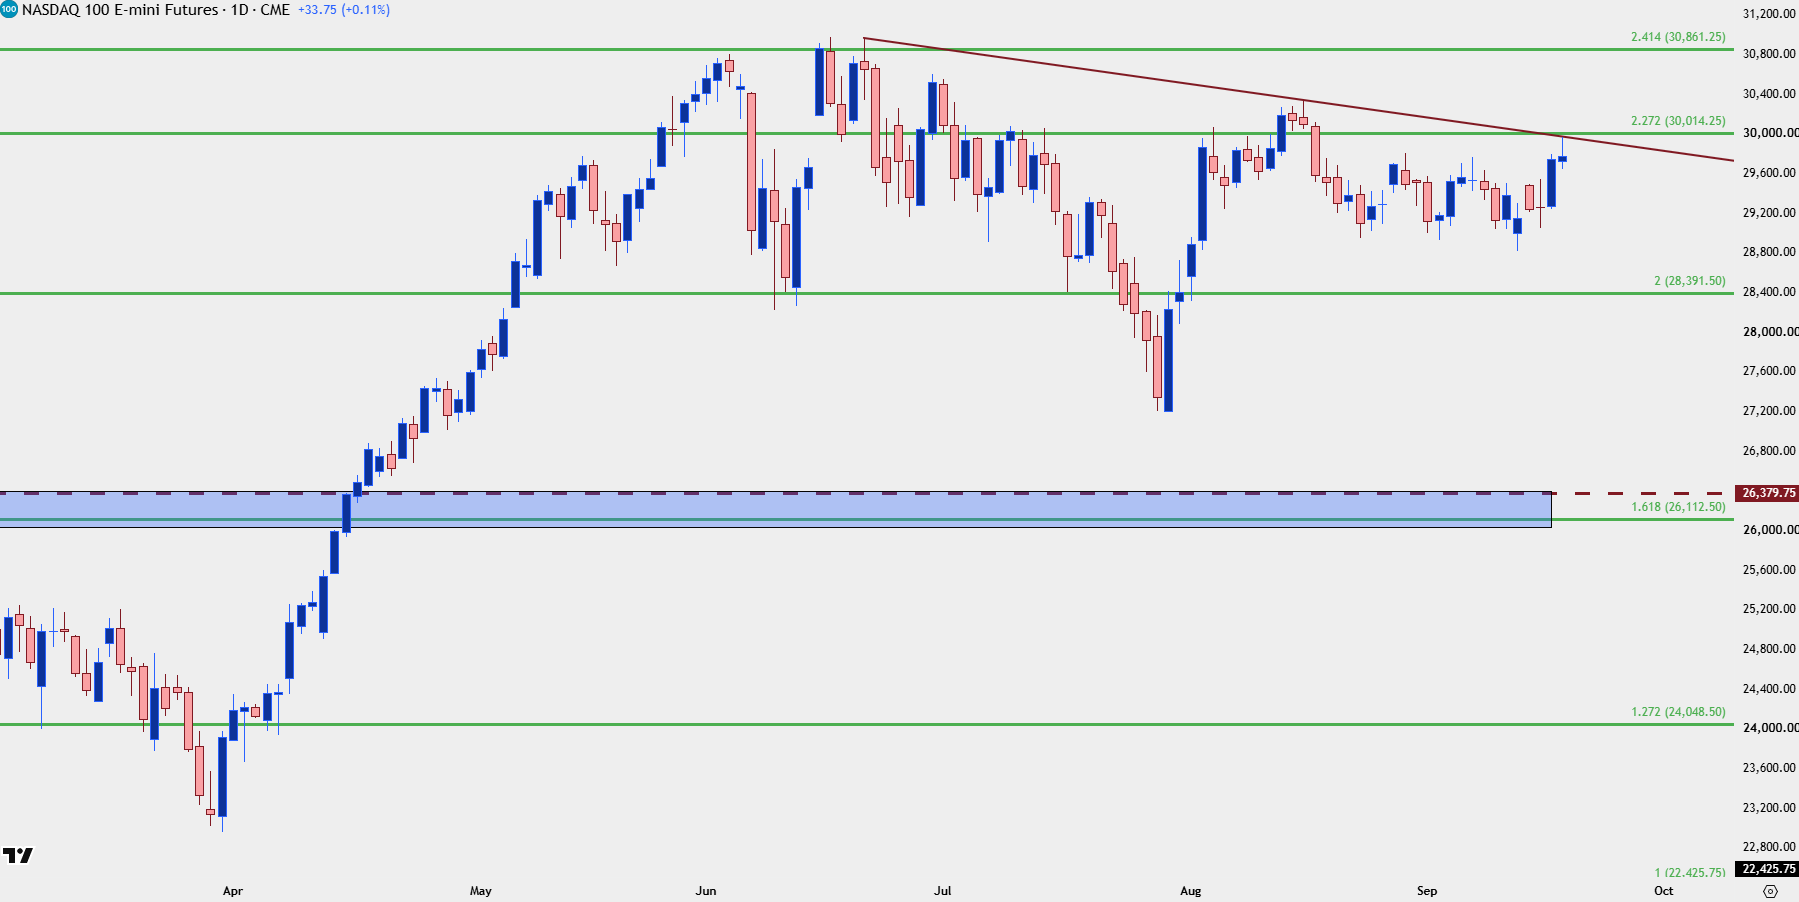
Chart prepared by James Stanley; data derived from Tradingview
A Look Back
Back in the year 2000 there was a similar theme in technology stocks, only instead of AI changing the world, it was the internet and dot coms. There’s several parallels here and I started looking into that beginning with the 2025 forecast on equity indices. I was looking for continued strength in stocks because as I said at the time coming into last year, timing a bubble popping is a perilous quest, and with a Fed set to remain accommodative there wasn’t really a push point to prod the pin to pop any bubble.
But that may be starting to shift. And a look at how this went down back in the year 2000 is informative as the Fed hiked rates by 25 bps in February, and stocks powered higher. They hiked again in March, and that set off a massive sell-off in the Nasdaq that saw the index lose as much as 41% over the next two months.
A 50 bp hike from the Fed actually helped to set a low in May of that year, which was followed by a 44% rally, as recovery took over. But that’s when the big ‘boom’ set forth as the Nasdaq then lost 81% over the next two years.
It was like a slow-motion trainwreck in hindsight, but living through it, there was mania on both sides particularly the rally after the 50 bp hike in May. But – what makes this matter today is how the S&P fared on a comparable basis where bulls were still bristling towards highs in September before the major leg of weakness started to show.
Nasdaq 100 Sept 1999-2002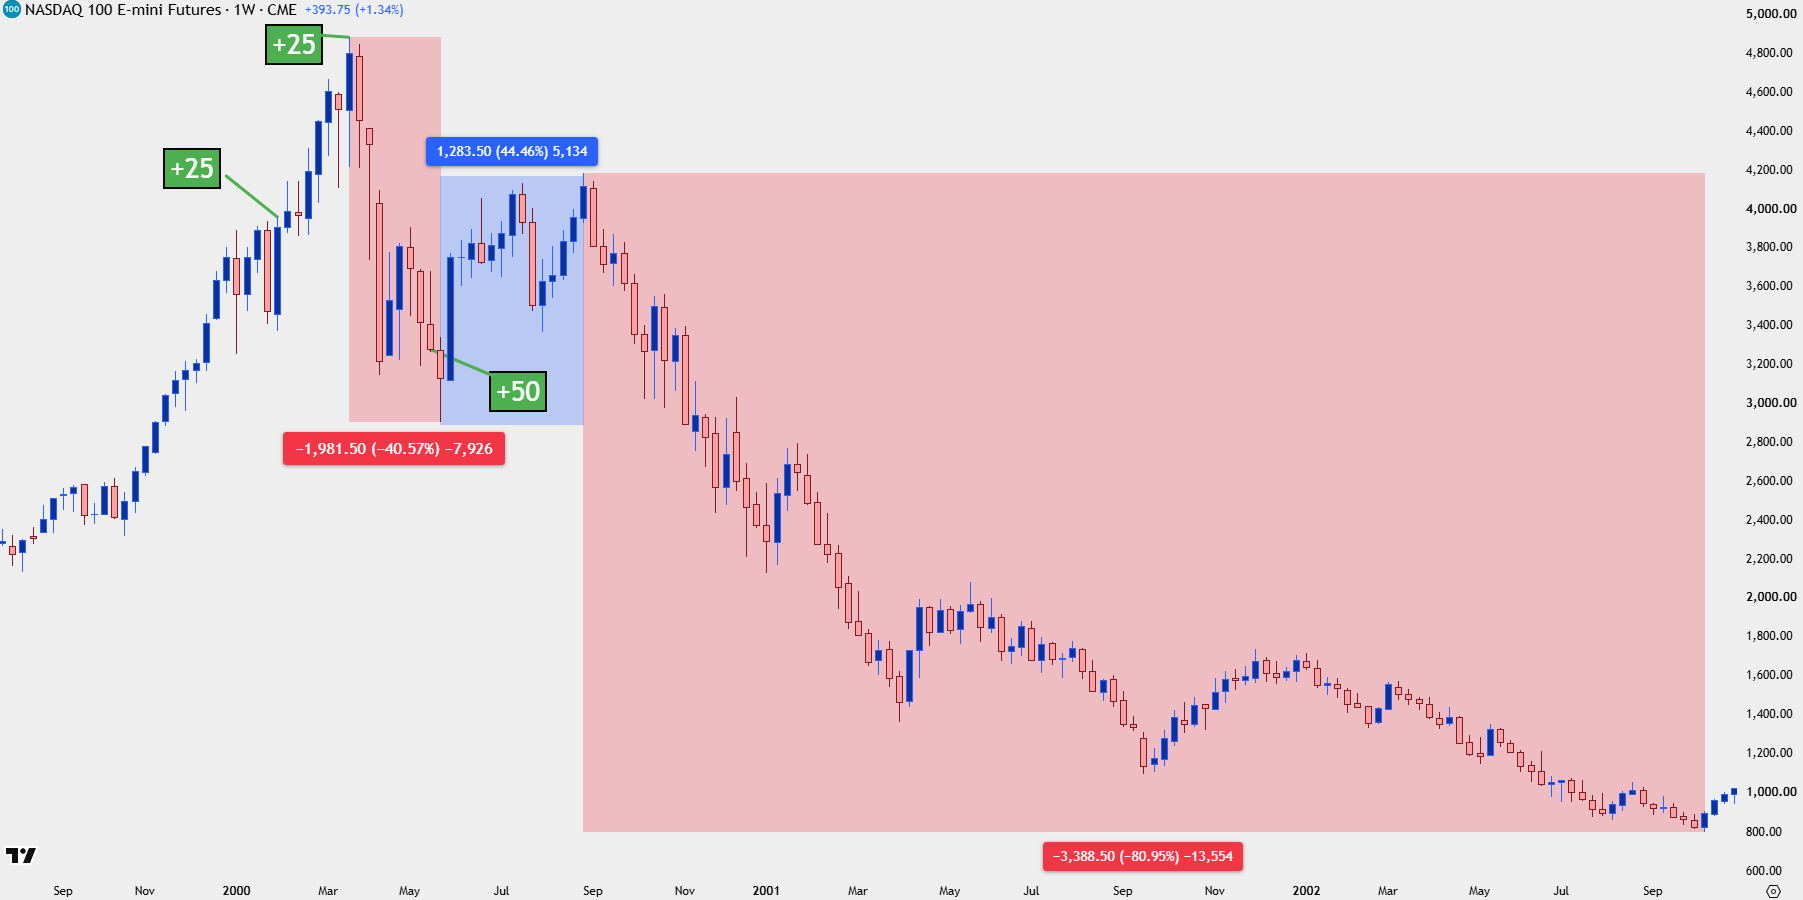
Chart prepared by James Stanley; data derived from Tradingview
Stocks and Opportunity Cost

When the financial collapse hit there was such high desperation that both the Fed and Treasury kept throwing measures at the wall just hoping to get something to stick. This is one reason why we have such dedication to forward guidance, as that was a key ingredient that finally helped bulls to take over larger recoveries in 2011.
But if you think about it forward guidance makes zero sense in a rising rate environment. Sure, if rates will stay low for a long time the central bank telling markets that rates will stay low for a long time compels investors to take on more risk. It also helps investors that are holding bonds to keep holding them, as they have little fear that the bottom will fall out and that prices will fall and yields will soar.
But if rates are going up – what is the point in scaring market participants out of holding bonds? You’re practically saying to investors that if you’re holding longer-term paper, well, get ready for a loss, because higher rates mean lower prices. But because the Fed had incorporated this as a part of their communication strategy and because it hadn’t yet blown up in their face, they just kept doing it.
And this is the kind of change that Kevin Warsh seems to want to represent.
But, with that said, it was another change around the financial collapse that has dominated and driven markets in a way that sets forth moral hazard, and that’s the prospect of the central bank buying and holding bonds. This is, in essence, subsidization of government debt, and it removes the market mechanism that punishes a government for spending too much. This artificial suppression of US government yields, both in Treasuries and mortgage backed securities, has created a monstrous problem as any effort towards ‘normalization’ has been attempted.
There’s also the risk side of that coin, as suppressed yields have driven more and more capital into stocks, riskier stocks, and this, like we saw going into the year 2000, has created outlandish valuations that are historically difficult to justify.
As yields go higher, many investors, for the first time in their careers, will have an actual opportunity cost: Should they bid the 7th or 8th pullback in AI tech stocks that are still at stretched valuations? Or, should they just lock up a 5% or 5.25% 10-year yield while getting some upside potential in the event that yields ultimately fall?
And on that, it’s difficult to imagine that yields remain at this high level for too long as a heavily indebted US government simply can’t afford it. They either have to force massive tax hikes to finance increasingly large deficits, or they have to spend considerably less, and more likely, with debt-to-GDP where it’s at, force a combination of the two.
But good luck getting elected on that platform of austerity where the pledge is ‘we will tax you more and give you less!’
That just feels incredibly unlikely.
What does seem more probabilistic is an eventual return to central bank bond buying but for that to even be an option, inflation first has to be tamed and that seems to be the primary prerogative of Kevin Warsh now.
At this point, the lifeblood of markets is US government debt and while we haven’t seen a massive move in equities yet, these are the types of things that take time, and from the 10-year yield chart below, this is not something I would want to be short of, at the moment, as yields look ready to break out in a very big way.
US 10-Year Note Treasury Yields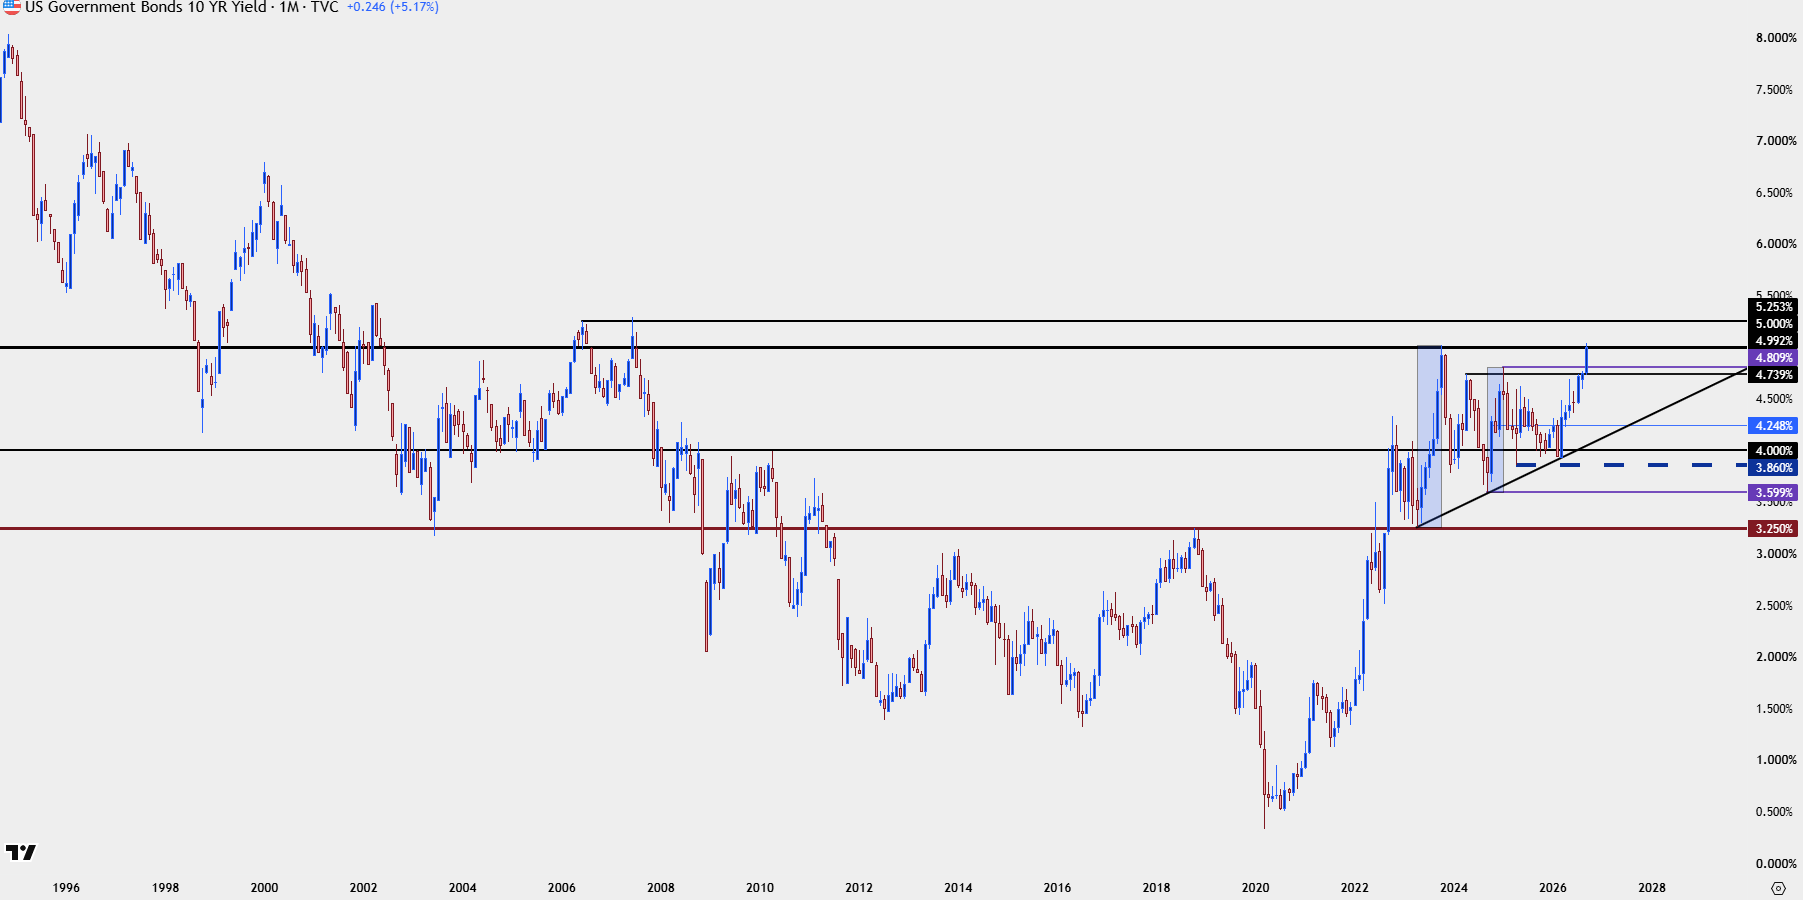
Chart prepared by James Stanley; data derived from Tradingview
--- written by James Stanley, Senior Market Analyst, Global Macro
Related tags:
Latest market news




Open an account in minutes
Experience award-winning platforms with fast and secure execution, and enjoy tight spreads from 0.5 pts on FX and 0.3 pts on indices.
Economic calendar
Web Trader platform
Our sophisticated web-based platform is packed with features.
Related articles
USD Exhaustion into Bearish Engulf: EUR/USD, GBP/USD, USD/JPY
It was a big week for the Dollar with stronger inflation pushing rate hike themes, with price action diverging as price printed a bearish engulf on the weekly DXY chart.
S&P 500 Forecast: SPX set for a weekly decline led lower by tech as AI worries linger
U.S. stocks have opened mixed as investors continue to worry about the financing behind the AI trade while also looking ahead to more earnings next week.


Magnificent Seven Earnings Preview: Is the AI Boom Facing Its Biggest Test Yet?
After a wobble in the broader AI trade, the Magnificent Seven" stocks are reporting earnings in the coming week - see the key themes and Nasdaq 100 levels to watch!

This report is intended for general circulation only. It should not be construed as a recommendation, or an offer (or solicitation of an offer) to buy or sell any financial products. The information provided does not take into account your specific investment objectives, financial situation or particular needs. Before you act on any recommendation that may be contained in this report, independent advice ought to be sought from a financial adviser regarding the suitability of the investment product, taking into account your specific investment objectives, financial situation or particular needs.
StoneX Financial Pte. Ltd., may distribute reports produced by its respective foreign entities or affiliates within the StoneX group of companies or third parties pursuant to an arrangement under Regulation 32C of the Financial Advisers Regulations. Where the report is distributed to a person in Singapore who is not an accredited investor, expert investor or an institutional investor (as defined in the Securities Futures Act), StoneX Financial Pte. Ltd. accepts legal responsibility to such persons for the contents of the report only to the extent required by law. Singapore recipients should contact StoneX Financial Pte. Ltd. at 6826 9988 for matters arising from, or in connection with the report.
In the case of all other recipients of this report, to the extent permitted by applicable laws and regulations neither StoneX Financial Pte. Ltd. nor its associated companies will be responsible or liable for any loss or damage incurred arising out of, or in connection with, any use of the information contained in this report and all such liability is hereby expressly disclaimed. No representation or warranty is made, express or implied, that the content of this report is complete or accurate.
StoneX Financial Pte. Ltd. is not under any obligation to update this report.
Trading CFDs carries a high level of risk that may not be suitable for some investors. Consider your investment objectives, level of experience, financial resources, risk appetite and other relevant circumstances carefully. The possibility exists that you could lose some or all of your investments, including your initial deposits. If in doubt, please seek independent expert advice. Visit www.forex.com/en-sg/terms-and-policies for the complete Risk Disclosure Statement.