




US CPI preview: Are we past peak inflation?
Headline inflation reading may show price pressures fading while the Fed’s preferred “core” (ex-energy and food) CPI measure shows that underlying inflation is still rising
Share this:

When is the July US CPI report?
The US Bureau of Labor Statistics (BLS) will release the July Consumer Price Index (CPI) report Wednesday, August 8 at 8:30 ET.
What are economists expecting for July CPI?
Consensus expectations are for headline CPI to come in at 0.2% m/m, 8.8% y/y, with the Core CPI report expected to print at 0.5% m/m, 6.1% y/y.
Last month’s headline CPI printed at 9.1% y/y, while the Core CPI was 5.9%.
CPI preview
We’ve seen dozens of nails hammered into the proverbial coffin of “team transitory” this year, but perhaps Jerome Powell and company can salvage a small win if inflation drops back below 9% this month.
The biggest factor suggesting that may be the case are gas prices, which have now fallen for over 50 straight days since the start of summer. Analysts estimated that gas prices fell at least 10% in July from June levels, likely subtracting 0.5% or more off the headline CPI reading this month. Likewise, food prices were also substantially lower in July than August, setting up a dynamic where the headline inflation reading may show price pressures fading while the Fed’s preferred “core” (ex-energy and food) CPI measure shows that underlying inflation is still rising as home prices and pent-up demand for economic reopening offset the more volatile components.
Beyond analysis of the individual components of inflation, there are some bigger-picture reasons to expect price pressures to moderate. Recent PMI surveys have indicated that businesses are seeing price pressures abate slightly, and according to the NY Fed, consumer inflation expectations for one year out are falling sharply. From a purely mechanical perspective, inflation was already picking up at this time last year, so the “base effects” from comparing current price increases to last year will make the top-line figures look less dramatic. We estimate that base effects will subtract roughly 0.5% from this month’s inflation forecasts on their own.
US CPI: Where next for the US dollar?
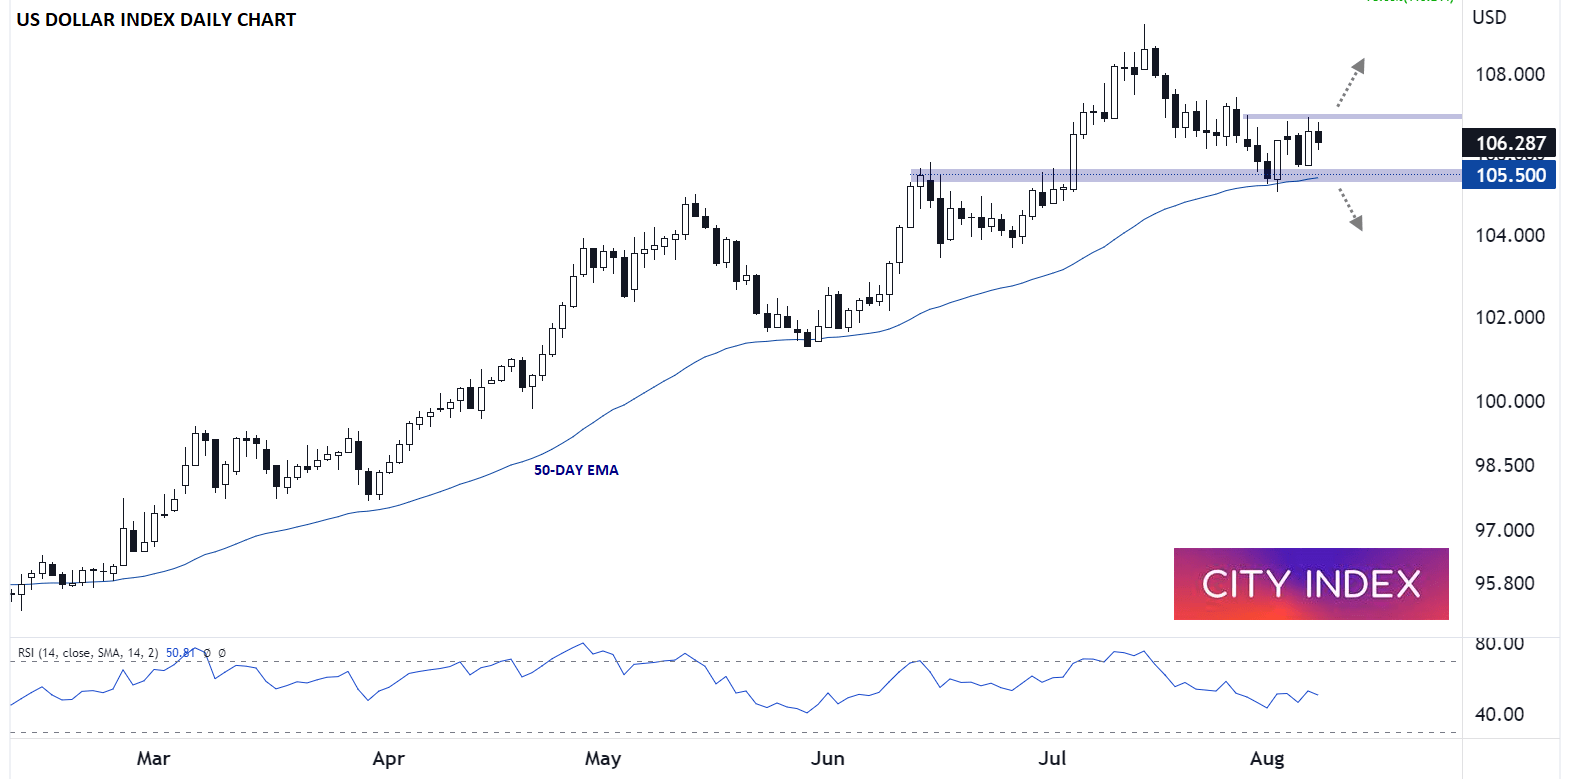
Using the US Dollar Index (DXY) as a proxy, the greenback has been riding its 50-day EMA higher for the past six months. As the chart below shows, the dollar index formed a “bullish engulfing candle” on the daily chart last week; for the uninitiated, this pattern signals a strong shift from selling to buying pressure and is often seen a significant lows in a market:
Source: StoneX, TradingView
If inflation comes in hotter than expected, it would tip the odds in favor of another 75bps interest rate hike from the Fed next month and likely boost the US dollar. A break above the 107.00 handle in that scenario could open the door for a potential retest of the dollar index’s June highs near 109.00. Meanwhile, a soft CPI report could weigh on the buck, with a move below the dollar index’s 50-day EMA near 105.50 suggesting that a deeper pullback toward 104.00 is likely.
When is the July US CPI report?
The US Bureau of Labor Statistics (BLS) will release the July Consumer Price Index (CPI) report Wednesday, August 8 at 8:30 ET.
What are economists expecting for July CPI?
Consensus expectations are for headline CPI to come in at 0.2% m/m, 8.8% y/y, with the Core CPI report expected to print at 0.5% m/m, 6.1% y/y.
Last month’s headline CPI printed at 9.1% y/y, while the Core CPI was 5.9%.
CPI preview
We’ve seen dozens of nails hammered into the proverbial coffin of “team transitory” this year, but perhaps Jerome Powell and company can salvage a small win if inflation drops back below 9% this month.
The biggest factor suggesting that may be the case are gas prices, which have now fallen for over 50 straight days since the start of summer. Analysts estimated that gas prices fell at least 10% in July from June levels, likely subtracting 0.5% or more off the headline CPI reading this month. Likewise, food prices were also substantially lower in July than August, setting up a dynamic where the headline inflation reading may show price pressures fading while the Fed’s preferred “core” (ex-energy and food) CPI measure shows that underlying inflation is still rising as home prices and pent-up demand for economic reopening offset the more volatile components.
Beyond analysis of the individual components of inflation, there are some bigger-picture reasons to expect price pressures to moderate. Recent PMI surveys have indicated that businesses are seeing price pressures abate slightly, and according to the NY Fed, consumer inflation expectations for one year out are falling sharply. From a purely mechanical perspective, inflation was already picking up at this time last year, so the “base effects” from comparing current price increases to last year will make the top-line figures look less dramatic. We estimate that base effects will subtract roughly 0.5% from this month’s inflation forecasts on their own.
US CPI: Where next for the US dollar?
Using the US Dollar Index (DXY) as a proxy, the greenback has been riding its 50-day EMA higher for the past six months. As the chart below shows, the dollar index formed a “bullish engulfing candle” on the daily chart last week; for the uninitiated, this pattern signals a strong shift from selling to buying pressure and is often seen a significant lows in a market:
Source: StoneX, TradingView
If inflation comes in hotter than expected, it would tip the odds in favor of another 75bps interest rate hike from the Fed next month and likely boost the US dollar. A break above the 107.00 handle in that scenario could open the door for a potential retest of the dollar index’s June highs near 109.00. Meanwhile, a soft CPI report could weigh on the buck, with a move below the dollar index’s 50-day EMA near 105.50 suggesting that a deeper pullback toward 104.00 is likely.
How to trade with City Index
You can trade with City Index by following these four easy steps:
- Open an account, or log in if you’re already a customer
• Open an account in the UK
• Open an account in Australia
• Open an account in Singapore
- Search for the market you want to trade in our award-winning platform
- Choose your position and size, and your stop and limit levels
- Place the trade




Open an account in minutes
Experience award-winning platforms with fast and secure execution, and enjoy tight spreads from 0.5 pts on FX and 0.3 pts on indices.
Economic calendar
Web Trader platform
Our sophisticated web-based platform is packed with features.
Related articles

FOMC Meeting Preview: Three Questions for Chairman Warsh
Assuming the Fed delivers the expected hike, traders will want to know WHAT could prompt another hike, WHY they hiked this time, and HOW to interpret the dot plot.

Crude Oil Price Outlook: WTI and Brent Lead the Market Narrative
Crude Oil Price Outlook: Crude oil remains the market’s dominant narrative despite conflicting headline signals


Dow Jones Breaks Support as Oil and Yields Hit Stocks
Dow Jones weakness links rising crude oil and Treasury yields with pressure on stocks, while a rebound leaves the broken uptrend unconfirmed.
This report is intended for general circulation only. It should not be construed as a recommendation, or an offer (or solicitation of an offer) to buy or sell any financial products. The information provided does not take into account your specific investment objectives, financial situation or particular needs. Before you act on any recommendation that may be contained in this report, independent advice ought to be sought from a financial adviser regarding the suitability of the investment product, taking into account your specific investment objectives, financial situation or particular needs.
StoneX Financial Pte. Ltd., may distribute reports produced by its respective foreign entities or affiliates within the StoneX group of companies or third parties pursuant to an arrangement under Regulation 32C of the Financial Advisers Regulations. Where the report is distributed to a person in Singapore who is not an accredited investor, expert investor or an institutional investor (as defined in the Securities Futures Act), StoneX Financial Pte. Ltd. accepts legal responsibility to such persons for the contents of the report only to the extent required by law. Singapore recipients should contact StoneX Financial Pte. Ltd. at 6826 9988 for matters arising from, or in connection with the report.
In the case of all other recipients of this report, to the extent permitted by applicable laws and regulations neither StoneX Financial Pte. Ltd. nor its associated companies will be responsible or liable for any loss or damage incurred arising out of, or in connection with, any use of the information contained in this report and all such liability is hereby expressly disclaimed. No representation or warranty is made, express or implied, that the content of this report is complete or accurate.
StoneX Financial Pte. Ltd. is not under any obligation to update this report.
Trading CFDs carries a high level of risk that may not be suitable for some investors. Consider your investment objectives, level of experience, financial resources, risk appetite and other relevant circumstances carefully. The possibility exists that you could lose some or all of your investments, including your initial deposits. If in doubt, please seek independent expert advice. Visit www.forex.com/en-sg/terms-and-policies for the complete Risk Disclosure Statement.