



US Dollar and Canadian Dollar Under Pressure as Japanese Yen Attracts Flows
USD/JPY and CAD/JPY show signs of weakness as safe-haven flows boost the Japanese yen. Symmetrical triangle and reversal patterns signal key levels.
Share this:

The Japanese yen is drawing renewed safe-haven demand as geopolitical tensions and tariff risks return to the spotlight. Both USD/JPY and CAD/JPY are flashing technical warning signs, with price action hinting at potential bearish reversals for the US dollar and Canadian dollar against the Japanese yen.
View related analysis:
View related analysis:
USD/JPY Technical Analysis: US Dollar vs Japanese Yen
The weekly chart for USD/JPY suggests the pair remains in a broader downtrend, with price action compressing within a symmetrical triangle — a pattern often interpreted as a bearish continuation formation. The triangle projects a downside target near 136.18, although several support zones between 138.50 and 140.00 could cushion the fall without a fresh catalyst for the Japanese yen or US dollar.
Adding to the uncertainty, USD/JPY is currently trading between its 50-week and 200-week exponential moving averages (EMAs), which further muddies the near-term technical outlook for the US dollar to Japanese yen exchange rate.
Symmetrical triangles typically break in the direction of the prevailing trend — in this case, lower — implying a potential bearish breakout for USD/JPY. However, the pair may continue consolidating within the narrowing range until a definitive move unfolds.
One possible catalyst for renewed Japanese yen strength and US dollar weakness could be renewed tariff concerns, which may shift market focus back toward anticipated Federal Reserve (Fed) rate cuts and weaken the greenback.
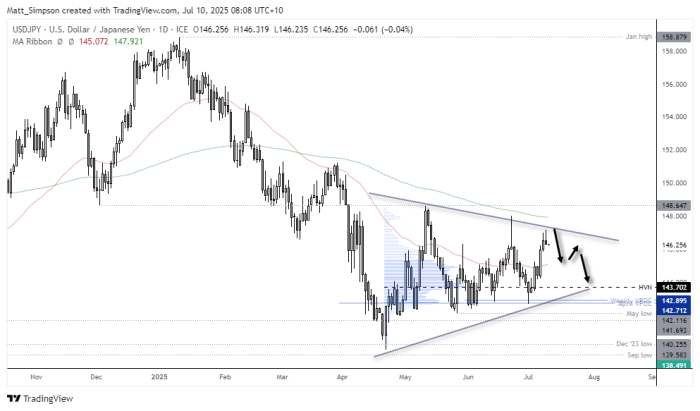
Chart analysis by Matt Simpson - data source: TradingView USD/JPY
USD/JPY Technical Analysis: Daily Chart
A small inverted hammer has formed on the USD/JPY daily chart near the upper triangle trendline — a potential signal of a swing high. The candle formed beneath a previous bearish pinbar and below the 200-day EMA, reinforcing the bearish setup for the US dollar against the Japanese yen.
Short-term bears could consider fading rallies toward yesterday’s high, placing stops above the 20-day EMA (147.9), and targeting a decline toward the 50-day EMA (154.07). A high-volume node (HVN) at 143.70 also offers a realistic short-term target for USD/JPY sellers.
That said, for USD/JPY to break decisively below these levels, a stronger bearish US dollar catalyst — such as rising expectations of Fed rate cuts or weaker inflation data — is likely required.
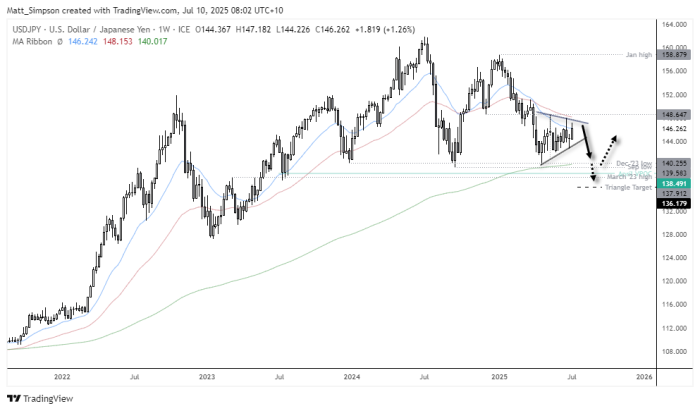
Chart analysis by Matt Simpson - data source: TradingView USD/JPY
CAD/JPY Technical Analysis: Canadian Dollar vs Japanese Yen
A steady uptrend has developed on the CAD/JPY daily chart, with the Canadian dollar advancing above its 50-day EMA and reaching a five-month high overnight. However, a bearish two-day reversal pattern — known as a dark cloud cover — has now formed, suggesting a potential pullback may be on the horizon.
Adding to the caution, the pattern formed near the June high, raising the risk of another false breakout. Similar setups in May and June saw failed breaks above monthly highs, followed by pullbacks of varying depths.
With USD/JPY showing signs of weakness as the Japanese yen attracts safe-haven demand amid renewed tariff headlines, there is scope for CAD/JPY to pull back. Traders may look for a retracement towards the 200-day EMA (currently 106.24) or the ascending trendline that has supported the uptrend since April.
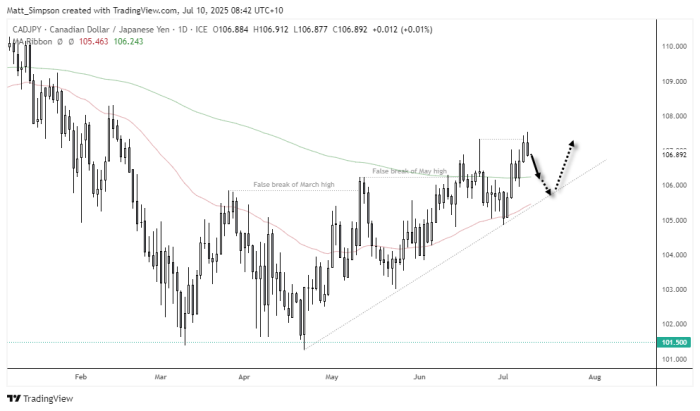
Chart analysis by Matt Simpson - data source: TradingView CAD/JPY
Economic Events in Focus (AEST / GMT+10)
09:50 JPY Foreign Bonds Buying, Foreign Investments in Japanese Stocks, PPI (Jun) (USD/JPY, AUD/JPY, CAD/JPY, EUR/JPY, Nikkei 225)
11:00 KRW Bank of Korea Meeting Schedule, Interest Rate Decision (Jul) (USD/KRW, KOSPI)
16:00 EUR German CPI , HICP (Jun) (EUR/USD, DAX)
20:00 GBP Thomson Reuters IPSOS PCSI (Jul) (GBP/USD, FTSE 100)
20:00 EUR Germany Thomson Reuters IPSOS PCSI (Jul) (EUR/USD, DAX)
22:30 USD Continuing Jobless Claims, Initial Jobless Claims, Jobless Claims 4-Week Avg. (USD/JPY, EUR/USD, USD/CAD, S&P 500, Nasdaq 100, Dow Jones, Gold, Crude Oil)
Friday, July 11
00:30 USD Natural Gas Storage (Crude Oil, Natural Gas)
03:00 USD 30-Year Bond Auction (USD/JPY, EUR/USD, USD/CAD, US Treasuries)
03:15 USD Fed Waller Speaks (USD, US indices)
03:30 GBP BoE Breeden Speaks (GBP/USD, FTSE 100)
04:30 USD FOMC Member Daly Speaks (USD, US indices)
06:30 USD Fed's Balance Sheet, Reserve Balances with Federal Reserve Banks (USD/JPY, EUR/USD, USD/CAD)
Related tags:


Open an account in minutes
Experience award-winning platforms with fast and secure execution, and enjoy tight spreads from 0.5 pts on FX and 0.3 pts on indices.
Economic calendar
Web Trader platform
Our sophisticated web-based platform is packed with features.
Related articles

USD/JPY Weekly Outlook: AI earnings could overshadow the Fed and BoJ
AI sentiment has become a major driver of US Treasury yields and USD/JPY. With Microsoft, Alphabet and Amazon reporting this week, central bank decisions may have competition for traders' attention.


USD/JPY Forecast: Is Rising Japanese Inflation Supporting the Yen?
As the trading week comes to an end, one of the most relevant developments in the FX market has been the renewed strength of the Japanese yen. This can be seen in the recent performance of USD/JPY, which has fallen nearly 1.0% over the last two trading sessions, highlighting a meaningful recovery in the Japanese currency against the U.S. dollar.


US Dollar Price Action Setups: EUR/USD, USD/JPY, GBP/USD, USD/CAD
The Dollar is working on its second consecutive red week and while sellers didn’t exactly pounce on fresh lows, there’s an opening door for bears to make a move.

This report is intended for general circulation only. It should not be construed as a recommendation, or an offer (or solicitation of an offer) to buy or sell any financial products. The information provided does not take into account your specific investment objectives, financial situation or particular needs. Before you act on any recommendation that may be contained in this report, independent advice ought to be sought from a financial adviser regarding the suitability of the investment product, taking into account your specific investment objectives, financial situation or particular needs.
StoneX Financial Pte. Ltd., may distribute reports produced by its respective foreign entities or affiliates within the StoneX group of companies or third parties pursuant to an arrangement under Regulation 32C of the Financial Advisers Regulations. Where the report is distributed to a person in Singapore who is not an accredited investor, expert investor or an institutional investor (as defined in the Securities Futures Act), StoneX Financial Pte. Ltd. accepts legal responsibility to such persons for the contents of the report only to the extent required by law. Singapore recipients should contact StoneX Financial Pte. Ltd. at 6826 9988 for matters arising from, or in connection with the report.
In the case of all other recipients of this report, to the extent permitted by applicable laws and regulations neither StoneX Financial Pte. Ltd. nor its associated companies will be responsible or liable for any loss or damage incurred arising out of, or in connection with, any use of the information contained in this report and all such liability is hereby expressly disclaimed. No representation or warranty is made, express or implied, that the content of this report is complete or accurate.
StoneX Financial Pte. Ltd. is not under any obligation to update this report.
Trading CFDs carries a high level of risk that may not be suitable for some investors. Consider your investment objectives, level of experience, financial resources, risk appetite and other relevant circumstances carefully. The possibility exists that you could lose some or all of your investments, including your initial deposits. If in doubt, please seek independent expert advice. Visit www.forex.com/en-sg/terms-and-policies for the complete Risk Disclosure Statement.