


US Dollar Price Action Setups: EUR/USD, GBP/USD, USD/JPY, USD/CAD
The USD continued to sell-off through the bulk of this week, all the way until a key Fibonacci level came into play at 98.98 which has now held the lows for two consecutive days.
Share this:

It was a bearish outing in USD as price grinded through the 99.40 support level and eventually started a test of the Fibonacci level at 98.98. That price has so far held the low for the past two days, and a bounce has formed as we move into the weekly close.
Last week an evening star formation formed on the daily chart of DXY, and until this morning, there was a very real risk of a similar formation building on the weekly chart. But so far there’s been a bounce from a key Fibonacci level at 98.98 and that’s put the weekly formation into question following a consistent slide that gook a few days to grind through the ‘s1’ support at 99.40.
At this point it’s still early, but 98.98 has put up a fight and we have matched lows on the daily chart with the prior support of 99.40 coming in as short-term resistance.
From the daily chart, we still have the higher-high and low structuring that began from the Fed’s first rate cut this year, and as I’ve been talking about in webinars even since before the turn began, the 98.98 level stood as my ‘s2’ support as this could constitute a higher-low. A hold here would be a clean showing from buyers and that would keep USD-strength scenarios in favor, particularly in pairs like USD/JPY and USD/CAD, as discussed below.
US Dollar Daily Chart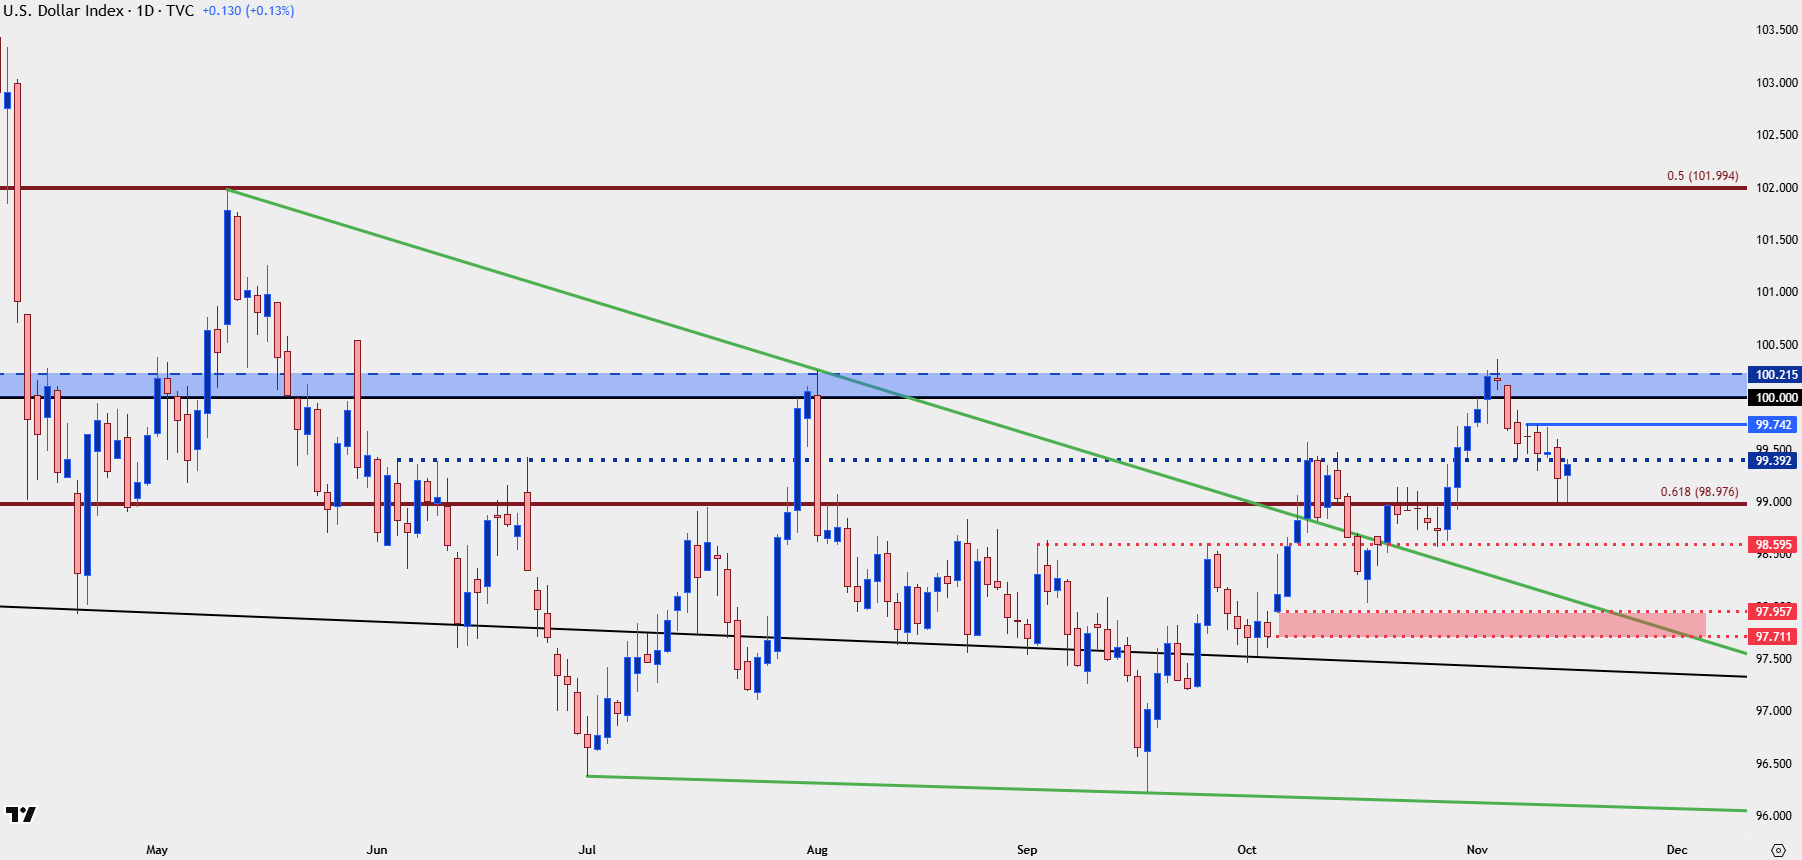
Chart prepared by James Stanley; data derived from Tradingview
US Dollar Shorter-Term
Given how quickly price pushed down this week, there does remain items for bearish structure on short-term charts. We’re already up for a test of the 99.40 level, which is my ‘s1’ from the daily, and I have the next resistance level up at 99.74.
If bulls can power through that, then the next zone on the radar is the key resistance at 100-100.22, which is the area that ultimately built the pullback two weeks ago. We had fresh four month highs in DXY but that 100.22 level, which set the lows last year when the Fed cut rates for the first time in that cycle, came in as harsh resistance.
If price can get back up for a re-test of that zone, the second test isn’t often like the first as some of the standing sell orders at that price, whether profit targets from longs or reversal entries from shorts, have already been triggered.
US Dollar Four-Hour Price Chart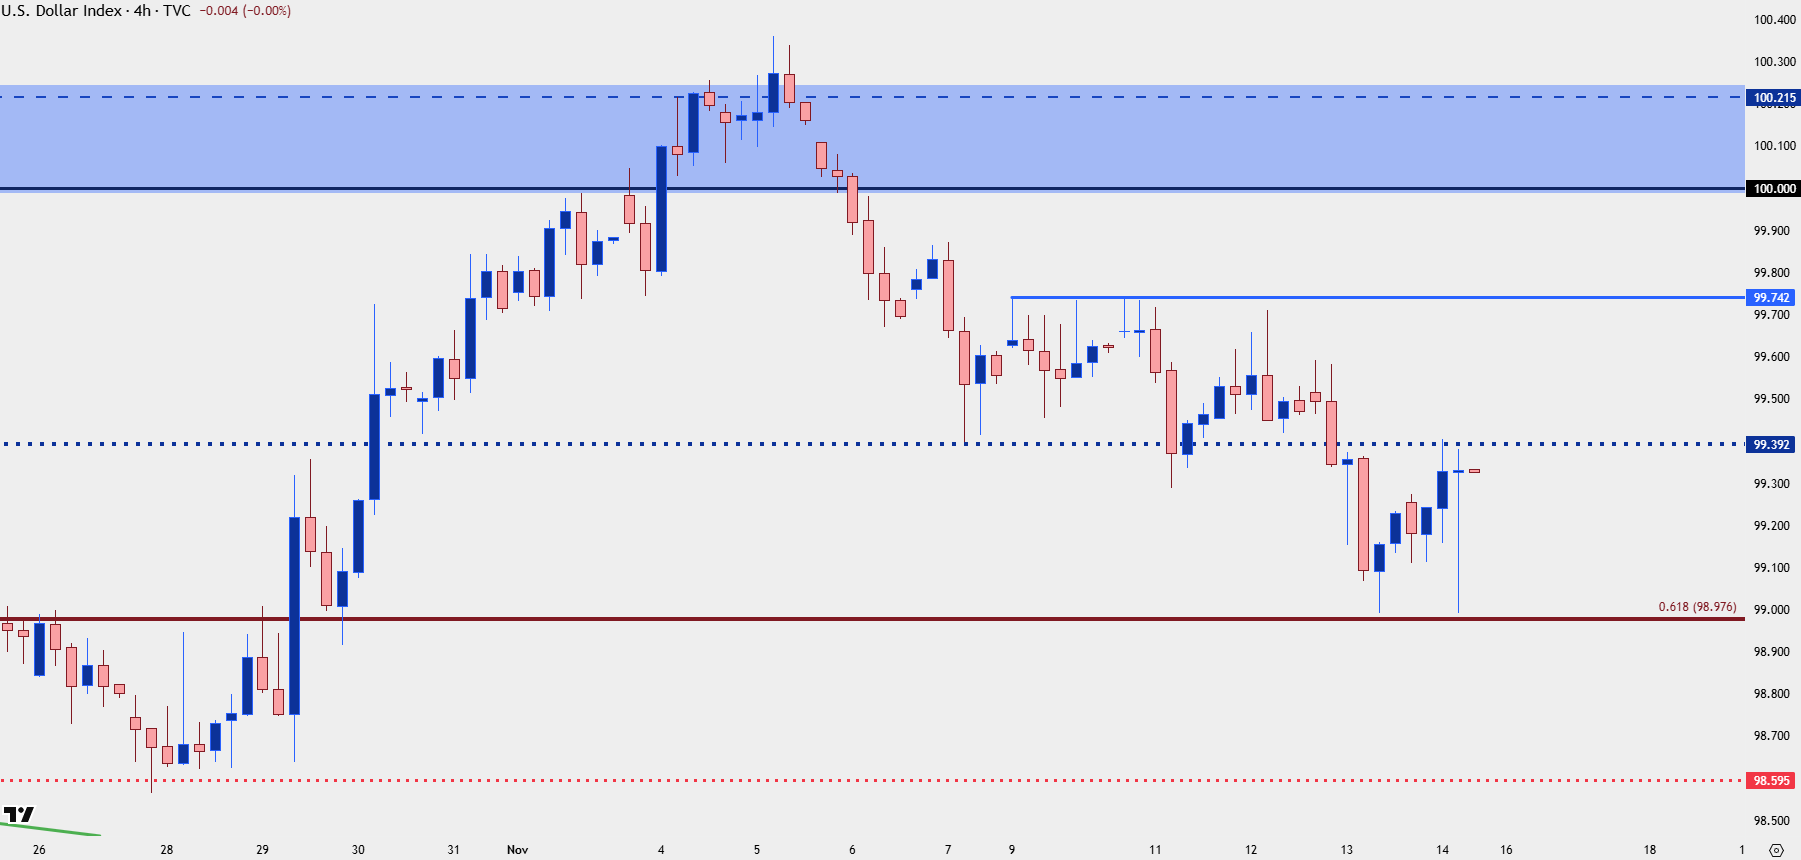
Chart prepared by James Stanley; data derived from Tradingview
EUR/USD
I still have EUR/USD on the USD-weakness side of the ledger and from the daily there can be an argument pushed in either direction. On the bullish side, price broke out of a falling wedge formation this week, opening the door for buyers to make a greater push.
But – from the daily chart we’re still within the bearish sequencing of lower-lows and lower-highs, and as I talked about in the webinar the week before last, that 1.1500 level is a major spot, and the type of psychological level that often doesn’t just give way on the first shot.
For next week, I’m tracking a support level at 1.1593 and then 1.1542, with overhead resistance at 1.1686, 1.1717 and then 1.1748.

EUR/USD Daily Chart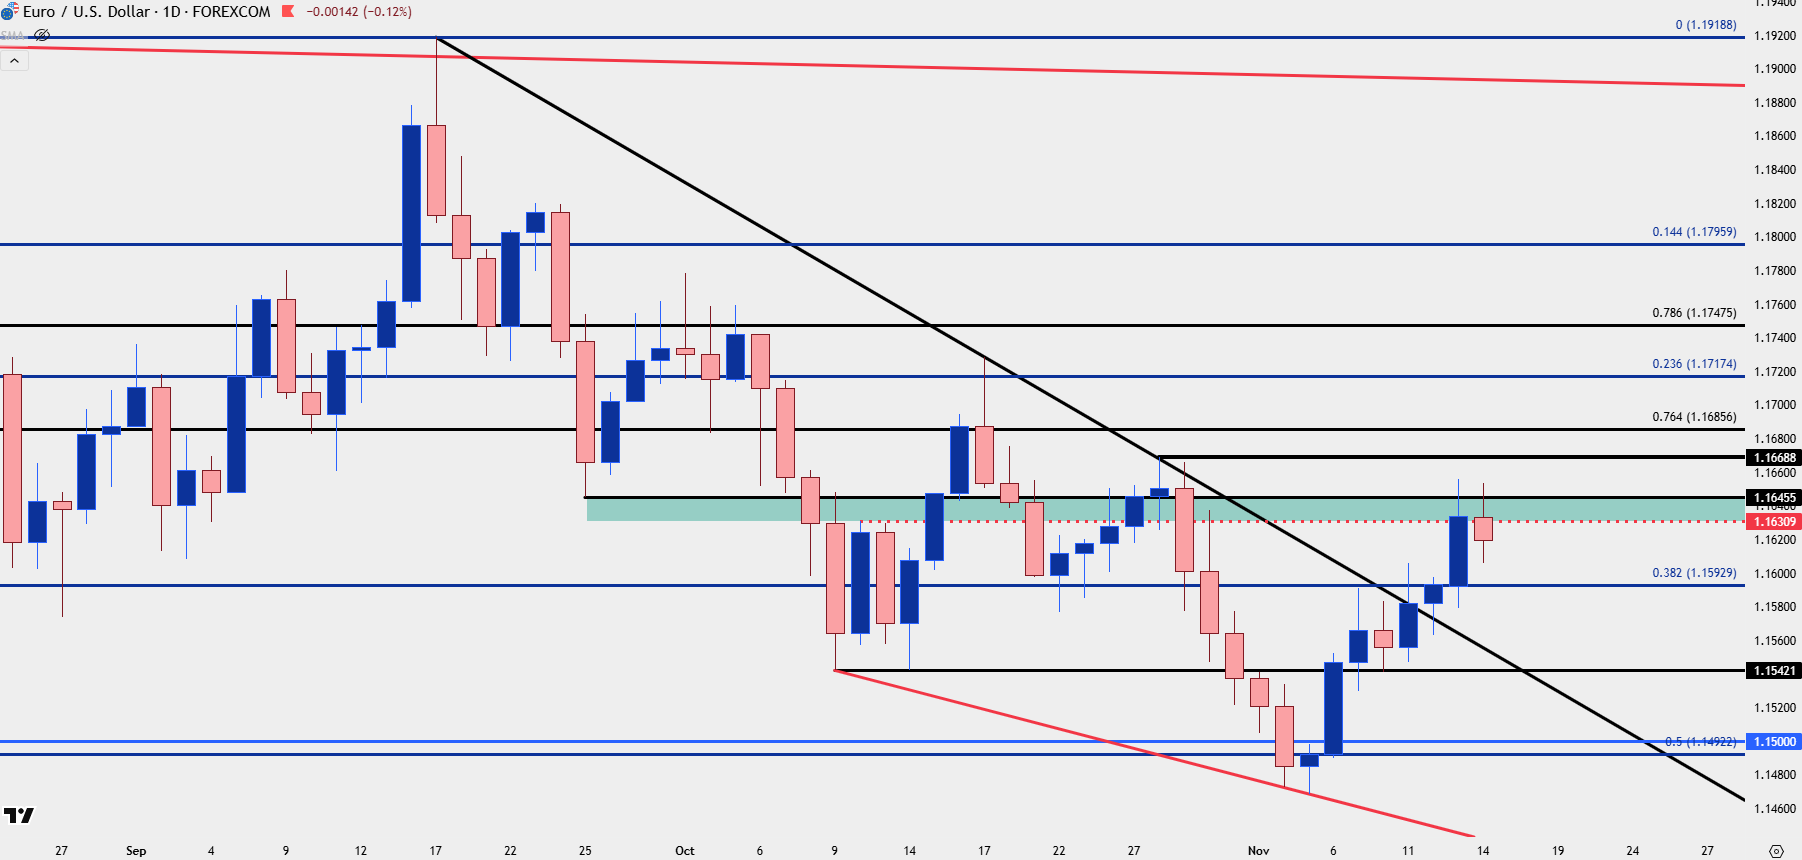
Chart prepared by James Stanley; data derived from Tradingview
GBP/USD
The reversal setup from deep oversold conditions on the daily chart played out through the bulk of this week after the pair bottomed just above the 1.3000 handle in the week prior – and there does remain a big spot of support in-play around the 1.3100 handle with today showing yet another higher-low; but comparably the above setup in EUR/USD seems a bit more bullish given that continued stretch up to fresh higher-highs.
Nonetheless I still think there’s more amenable pastures elsewhere for USD-strength and there is still a key spot of support in-play on Cable, so I’m going to keep this one on the USD-weakness side of the ledger for now, while looking to that 1.3100 zone as key support.
If that support gives way next week, the door opens for short-term breakout strategies towards 1.3050 and then 1.3010; I’d be careful staying aggressive for a test of 1.3000 flat as a psychological level of that nature can produce some drama, particularly after the first re-test in six or seven months.
GBP/USD Daily Chart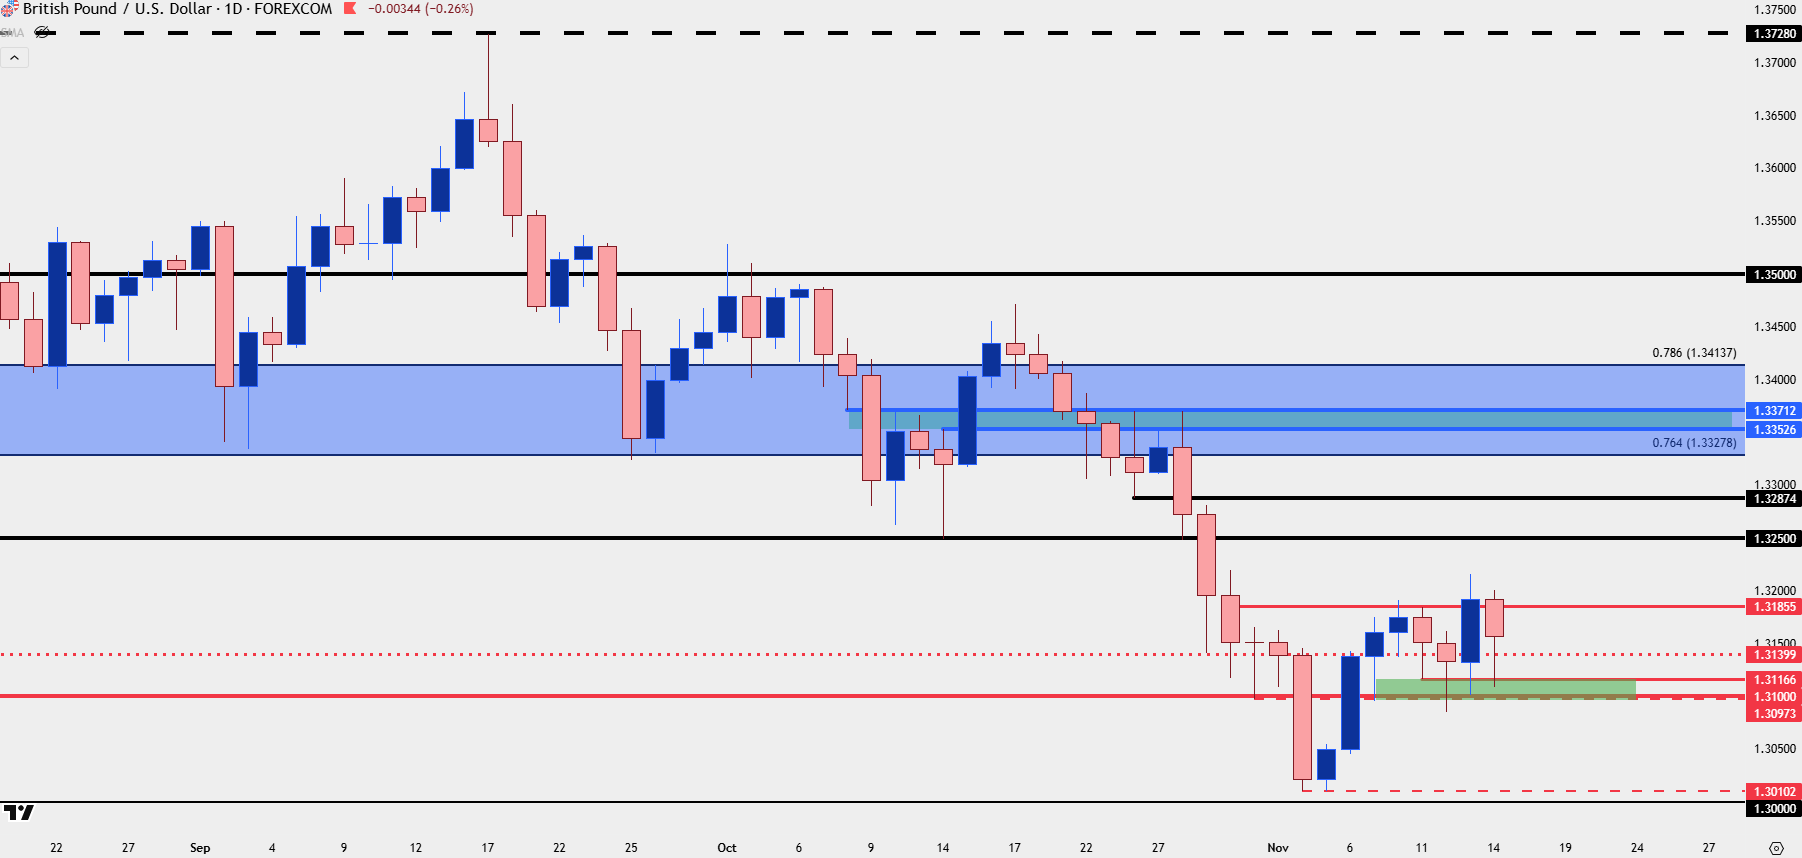
Chart prepared by James Stanley; data derived from Tradingview
USD/JPY
For USD-strength, I still think USD/JPY is the most attractive major pair at the moment, with an important caveat. The 155.00 level is one of those psychological prices that can bring some drama in to the equation, and like I talked about in the video earlier this week, that can lend itself to strategy adjustment – where pullbacks and support tests are still attractive on the long side while breakouts and chasing is a bit more daunting.
And related – traders looking to avoid the Dollar altogether can take that Yen-weakness and focus it elsewhere.
I looked at a breakout setup in GBP/JPY on Wednesday and that one broke out cleanly and ran to the next resistance before staging a pullback.
That type of approach would, in essence, look to take advantage of the deductions offered in this article, where GBP/USD has been more attractive for USD-weakness while JPY has been more attractive for Dollar-strength.

GBP/JPY Four-Hour: Breakout Hits Resistance, Pulls Back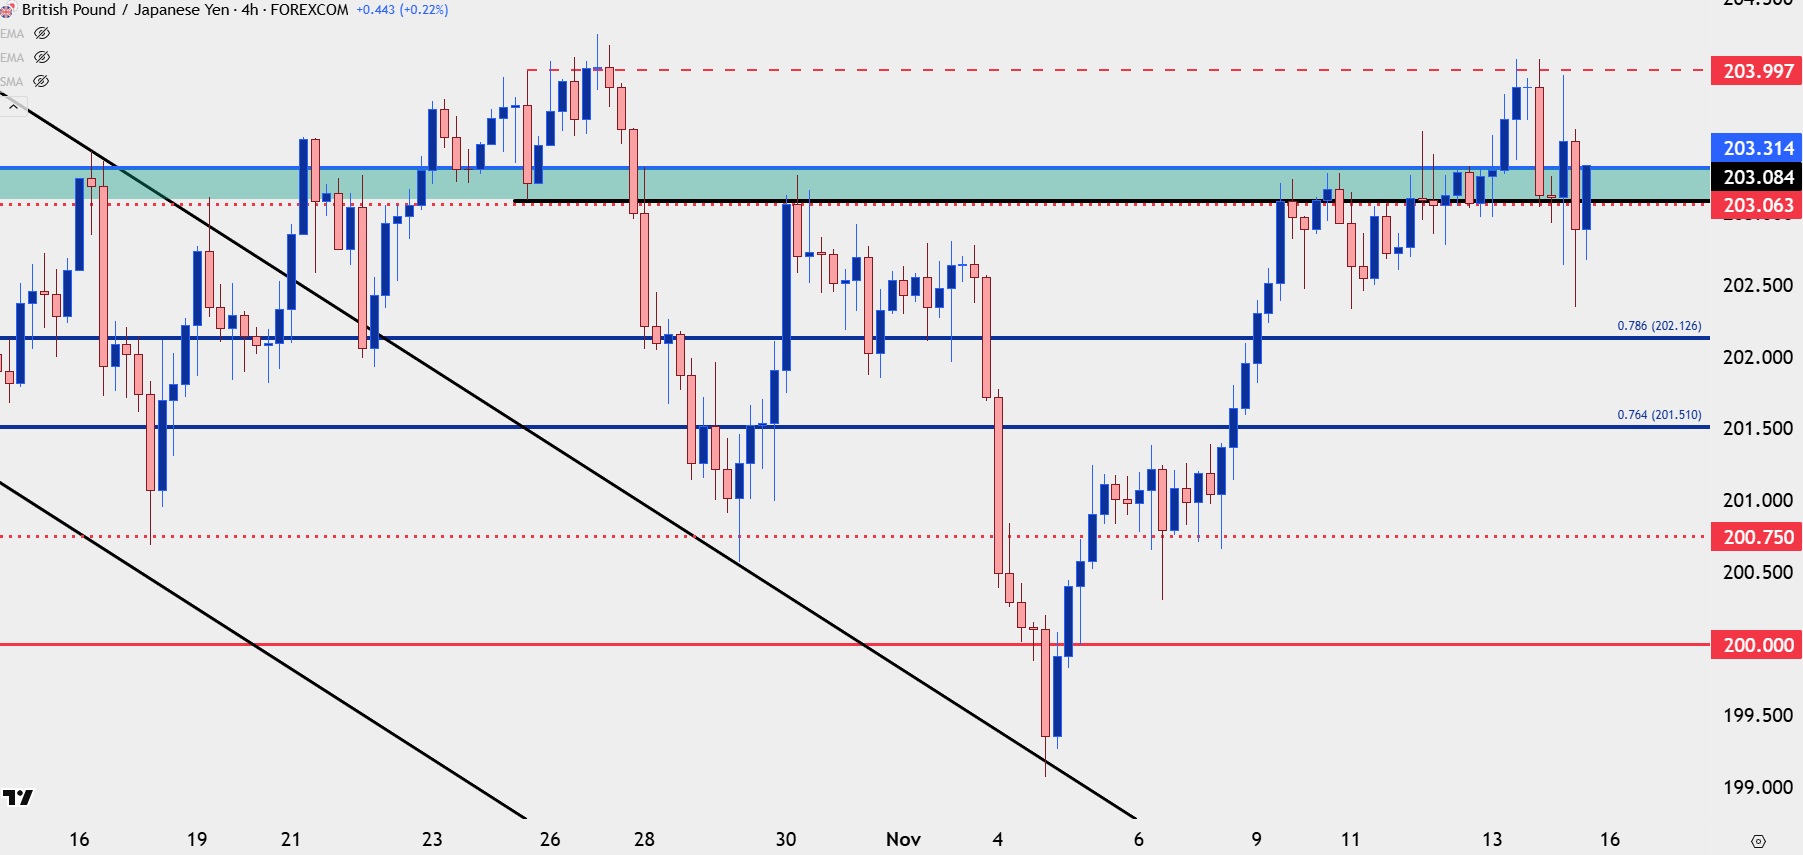
Chart prepared by James Stanley; data derived from Tradingview
USD/JPY Levels
In USD/JPY, we’ve already seen a sizable reaction from the pullback and price is pushing up for another test of the 155.00 handle.
If we get above that particularly if it happens quickly next week, my expectation would be another comment from the Finance Ministry designed as a veiled threat of intervention. But I’m not expecting anything of that ilk to actually take place until we’re looking at a 160.00 level or so, and that keeps the pair as attractive for pullbacks – and if we do see 155.00 broken through, that level can quickly become support potential for corresponding pullbacks in the event of an intervention threat.
For deeper structure, there’s a short-term level at prior resistance of 154.45 and then 153.23 after which 151.95, the high from 2022 and 2023, sets up as ‘s3’ support for the pair.
USD/JPY Daily Price Chart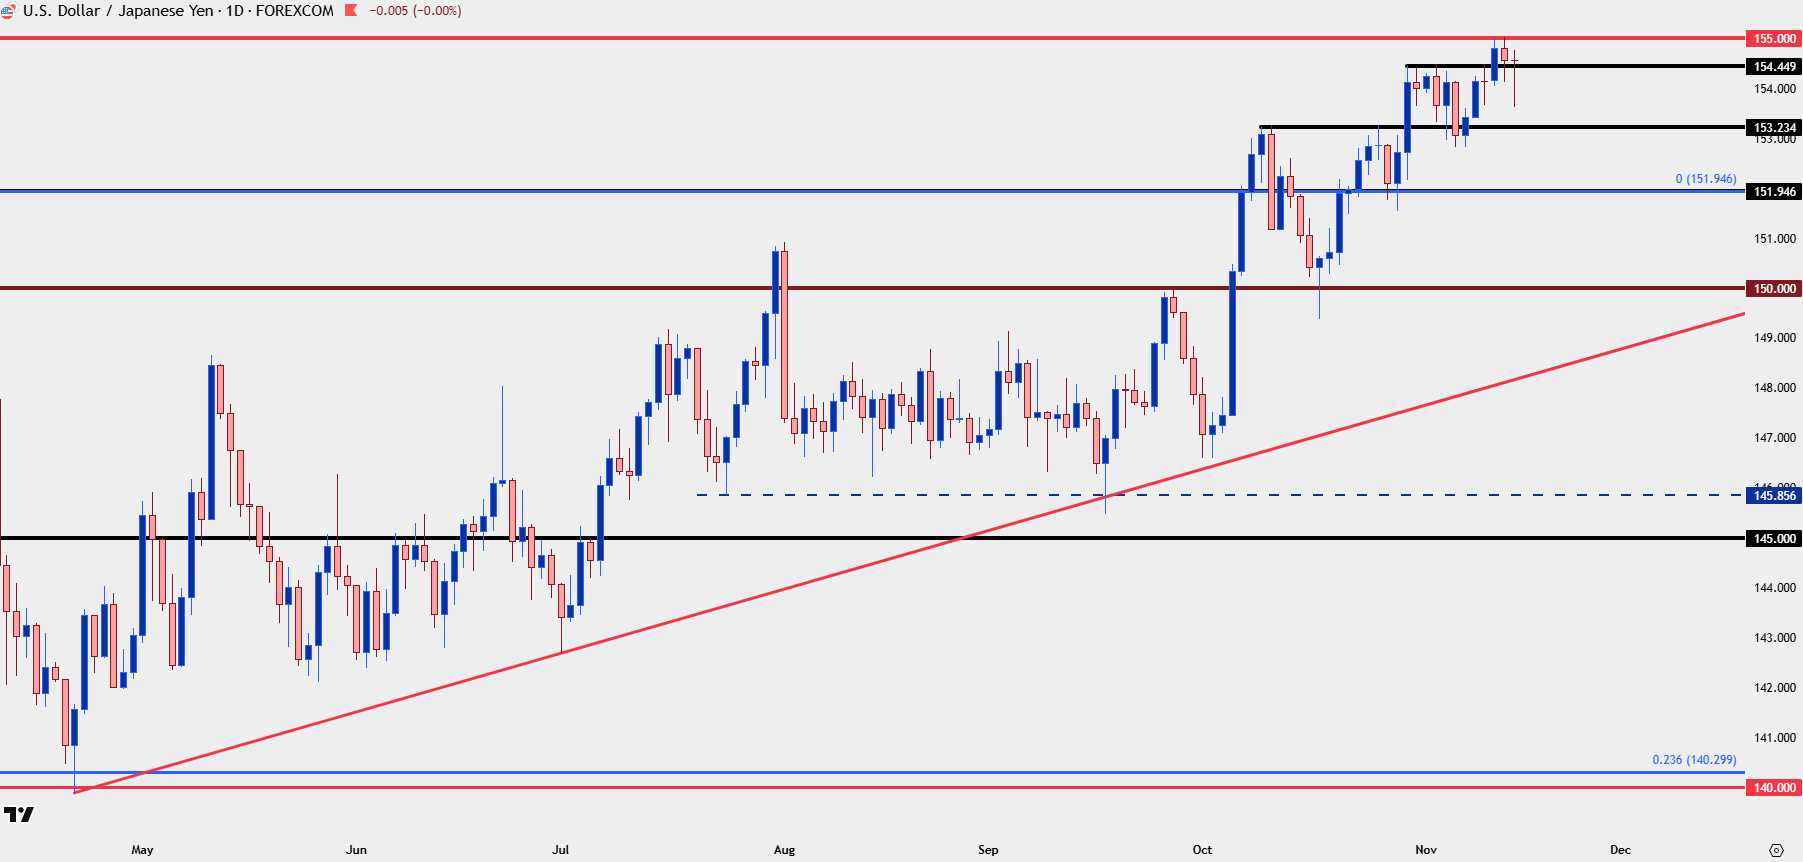
Chart prepared by James Stanley; data derived from Tradingview
USD/CAD 1.4000 Test
Also on my bullish-USD side of the equation is USD/CAD, which has continued to put up a fight at support of 1.4000.
That’s a major psychological level for the pair and it was a big spot of resistance back in May; and this week it held support for multiple days until yesterday’s bounce appeared. Admittedly, the setup is perhaps less exciting than a USD/JPY where one can dream of massive breakouts and long-term continuation, as USD/CAD has a big spot of resistance overhead around 1.4151 which is what ultimately stalled the breakout two weeks ago, but as far as technical structure, the backdrop remains clean, in my opinion, and a breach of short-term resistance at 1.4068 opens the door for re-test of the seven-month high and prior support-turned-resistance in the 1.4151-1.4178 zone.
USD/CAD Daily Chart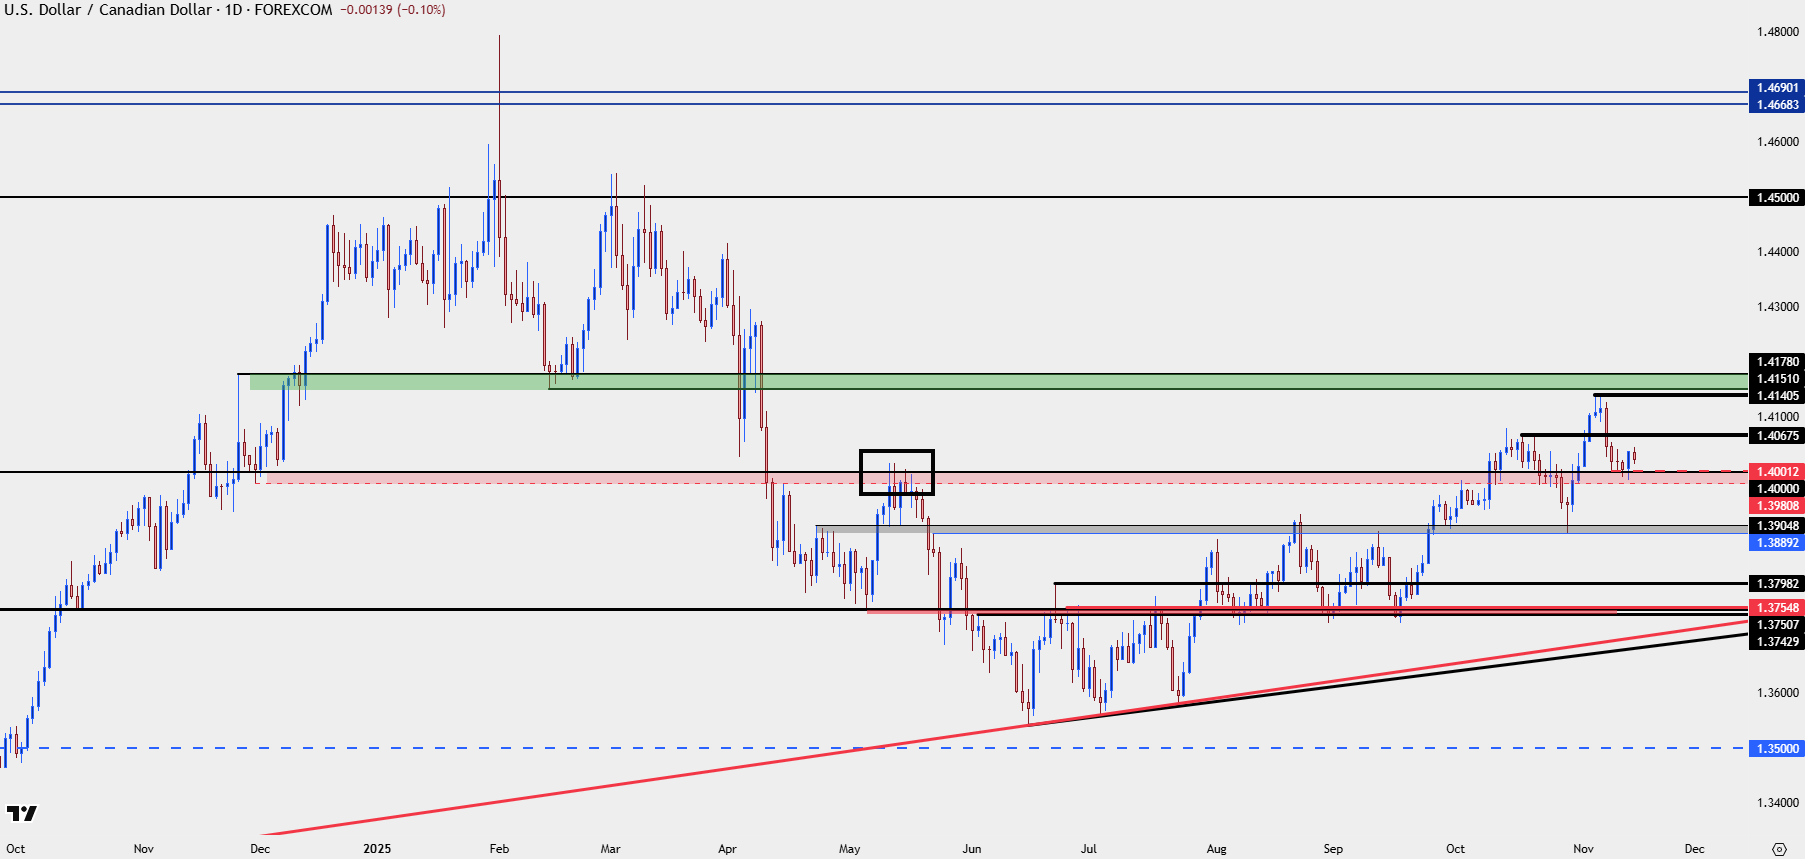
Chart prepared by James Stanley; data derived from Tradingview
--- written by James Stanley, Senior Market Analyst, Global Macro


Open an account in minutes
Experience award-winning platforms with fast and secure execution, and enjoy tight spreads from 0.5 pts on FX and 0.3 pts on indices.
Economic calendar
Web Trader platform
Our sophisticated web-based platform is packed with features.
Related articles
Gold Breaks Down on Descending Triangle, Sets Up $4k Test
Gold started last week with a strong sell-off but from that move a bounce developed. Bulls could not hold on through the weekly close, however, and the bearish structure remains in-place for XAU/USD.

USD/JPY weekly outlook: Quarter turn scrambles rates regime
USD/JPY’s tight relationship with front-end US rates broke down sharply last week, but quarter-turn flows and positioning suggest the disconnect may prove temporary.


USD/CAD forecast: rally could accelerate above June highs at 1.4250
USD/CAD recovered quickly after weaker US jobs data, keeping the bullish trend in focus. A move above the June highs could accelerate the rally as inflation keeps the Fed under pressure.

This report is intended for general circulation only. It should not be construed as a recommendation, or an offer (or solicitation of an offer) to buy or sell any financial products. The information provided does not take into account your specific investment objectives, financial situation or particular needs. Before you act on any recommendation that may be contained in this report, independent advice ought to be sought from a financial adviser regarding the suitability of the investment product, taking into account your specific investment objectives, financial situation or particular needs.
StoneX Financial Pte. Ltd., may distribute reports produced by its respective foreign entities or affiliates within the StoneX group of companies or third parties pursuant to an arrangement under Regulation 32C of the Financial Advisers Regulations. Where the report is distributed to a person in Singapore who is not an accredited investor, expert investor or an institutional investor (as defined in the Securities Futures Act), StoneX Financial Pte. Ltd. accepts legal responsibility to such persons for the contents of the report only to the extent required by law. Singapore recipients should contact StoneX Financial Pte. Ltd. at 6826 9988 for matters arising from, or in connection with the report.
In the case of all other recipients of this report, to the extent permitted by applicable laws and regulations neither StoneX Financial Pte. Ltd. nor its associated companies will be responsible or liable for any loss or damage incurred arising out of, or in connection with, any use of the information contained in this report and all such liability is hereby expressly disclaimed. No representation or warranty is made, express or implied, that the content of this report is complete or accurate.
StoneX Financial Pte. Ltd. is not under any obligation to update this report.
Trading CFDs carries a high level of risk that may not be suitable for some investors. Consider your investment objectives, level of experience, financial resources, risk appetite and other relevant circumstances carefully. The possibility exists that you could lose some or all of your investments, including your initial deposits. If in doubt, please seek independent expert advice. Visit www.forex.com/en-sg/terms-and-policies for the complete Risk Disclosure Statement.