



US Mortgage Rates fall for the first time in 11 weeks!
When will the housing market turn up again? This will most likely be after mortgage rates move lower.
Share this:

The average MBA 30-Year Mortgage Rate for the week ending October 28th fell to 7.06%. This was the first weekly decrease in the benchmark rate in 11 weeks. The previous week’s reading of 7.16% was the highest since 2001. With interest rates this high, the US housing data for September fell in most of the key data points as home buyers moved to the sidelines. Pending Home sales were down 10.2% MoM vs a previous reading of -1.9% MoM. New Home Sales were down 10.9% MoM vs an August reading of +24.7% MoM. Finally, Existing Home Sales were down 1.5% MoM vs -0.8% MoM in August. On the bright side for buyers, the S&P/Case-Schiller Home Prince Index fell 1.6% MoM, although this hardly makes up for the jump in interest rates. The big question housing buys want to know is “Will interest rates fall further below the 2001 levels anytime soon?”
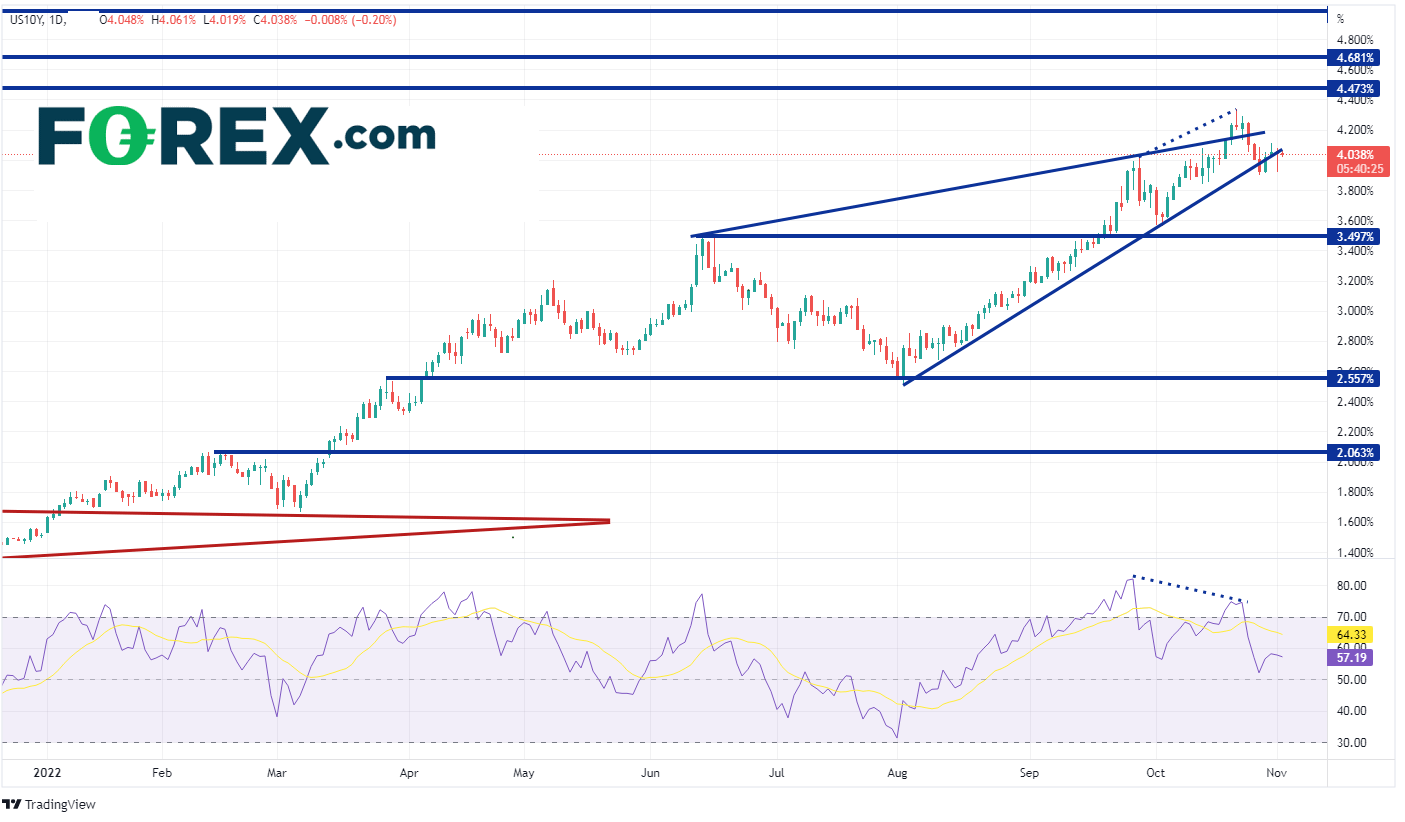
30 Year Mortgage rates in the US are based primarily off the 10-year US Treasury Yield. After breaking above a symmetrical triangle (red) early in 2022 near 1.69%, yields began moving aggressively higher. Yields moved to 3.497% on June 14th and pulled back to 2.56% in August 2nd. This set up an ascending wedge formation. Expectations are that the yield will break lower out of an ascending wedge. However, as price neared the apex, it initially broke above the formation on October 20th, reaching a high of 4.335% on October 21st. Notice that the RSI was diverging with yields in overbought territory. Thus, yields have since pulled back to the bottom trendline of the wedge, making a near-term low of 3.90%.
Source: Tradingivew, Stone X
Heading into the November FOMC meeting, the US 10-year Yield has pulled back and is oscillating around 4%. If the key yield breaks higher after the FOMC meeting, first resistance is at the lows of October 24th near 4.13%, then the top trendline of the long-term wedge near 4.23%. If yields continue higher and breakthrough the October 24th highs of 4.335%, they could be on the way to 4.473%, the highest level since November 2007! However, if the resistance holds and 10-year yields move lower, the first support is at the 38.2% Fibonacci retracement level from the lows of August 2nd to the highs of October 21st at 3.64%. Below there, yields can fall to the highs of June 14th at 3.497% and then the 50% retracement of the previously mentioned timeframe at 3.426%.

Source: Tradingivew, Stone X
When will the housing market turn up again? This will most likely be after mortgage rates move lower, which will depend on the movement of the US 10-year treasury yield. Watch the Fed later today. A 75bps rate hike is already priced. However, traders need to pay attention to the statement and the press conference which follows to determine if the Fed will slow the pace of hikes moving forward!
The average MBA 30-Year Mortgage Rate for the week ending October 28th fell to 7.06%. This was the first weekly decrease in the benchmark rate in 11 weeks. The previous week’s reading of 7.16% was the highest since 2001. With interest rates this high, the US housing data for September fell in most of the key data points as home buyers moved to the sidelines. Pending Home sales were down 10.2% MoM vs a previous reading of -1.9% MoM. New Home Sales were down 10.9% MoM vs an August reading of +24.7% MoM. Finally, Existing Home Sales were down 1.5% MoM vs -0.8% MoM in August. On the bright side for buyers, the S&P/Case-Schiller Home Prince Index fell 1.6% MoM, although this hardly makes up for the jump in interest rates. The big question housing buys want to know is “Will interest rates fall further below the 2001 levels anytime soon?”
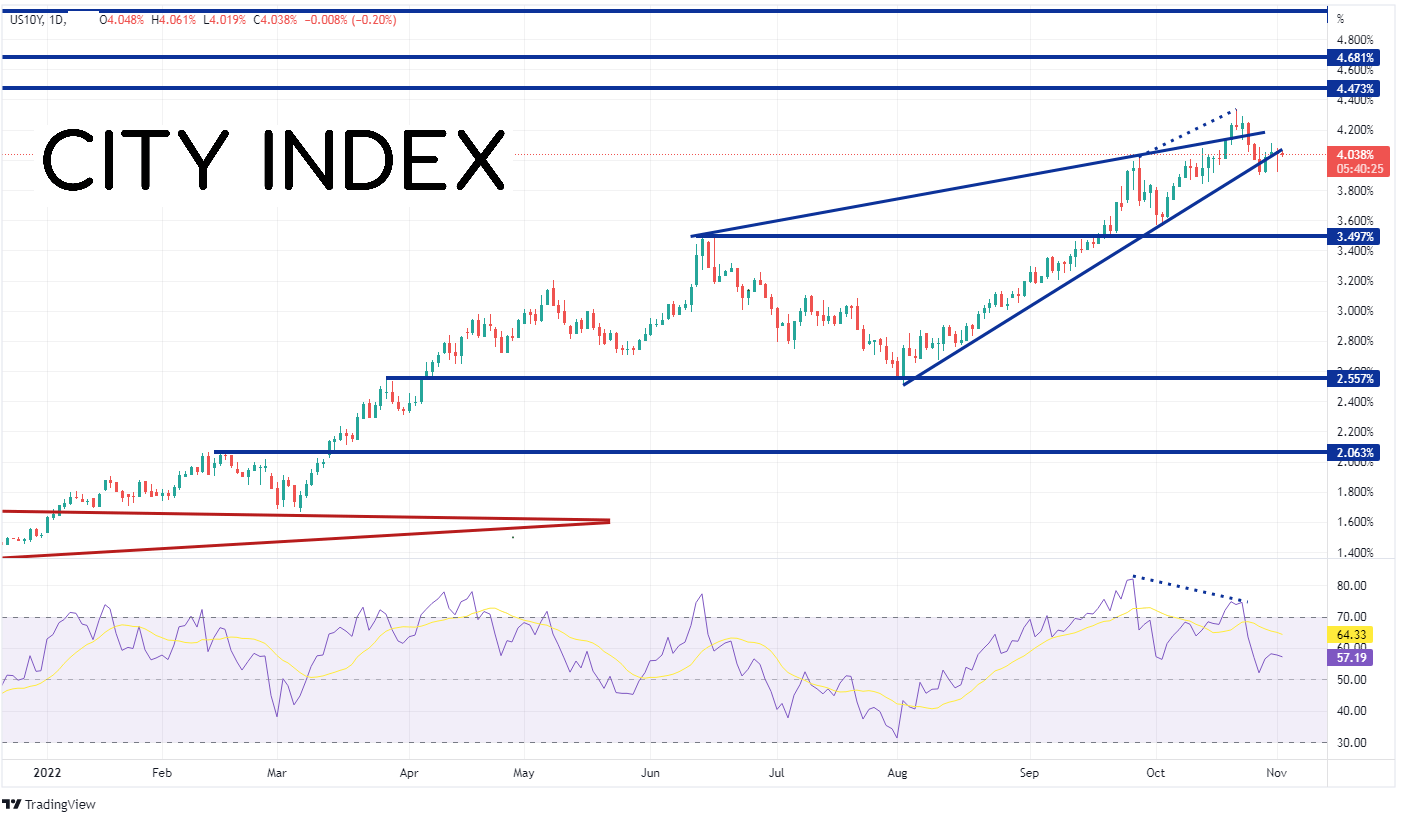
30 Year Mortgage rates in the US are based primarily off the 10-year US Treasury Yield. After breaking above a symmetrical triangle (red) early in 2022 near 1.69%, yields began moving aggressively higher. Yields moved to 3.497% on June 14th and pulled back to 2.56% in August 2nd. This set up an ascending wedge formation. Expectations are that the yield will break lower out of an ascending wedge. However, as price neared the apex, it initially broke above the formation on October 20th, reaching a high of 4.335% on October 21st. Notice that the RSI was diverging with yields in overbought territory. Thus, yields have since pulled back to the bottom trendline of the wedge, making a near-term low of 3.90%.
Source: Tradingivew, Stone X
Trade 10 year Treasury bonds now: Login or Open a new account!
• Open an account in the UK
• Open an account in Australia
• Open an account in Singapore
Heading into the November FOMC meeting, the US 10-year Yield has pulled back and is oscillating around 4%. If the key yield breaks higher after the FOMC meeting, first resistance is at the lows of October 24th near 4.13%, then the top trendline of the long-term wedge near 4.23%. If yields continue higher and breakthrough the October 24th highs of 4.335%, they could be on the way to 4.473%, the highest level since November 2007! However, if the resistance holds and 10-year yields move lower, the first support is at the 38.2% Fibonacci retracement level from the lows of August 2nd to the highs of October 21st at 3.64%. Below there, yields can fall to the highs of June 14th at 3.497% and then the 50% retracement of the previously mentioned timeframe at 3.426%.

Source: Tradingivew, Stone X
When will the housing market turn up again? This will most likely be after mortgage rates move lower, which will depend on the movement of the US 10-year treasury yield. Watch the Fed later today. A 75bps rate hike is already priced. However, traders need to pay attention to the statement and the press conference which follows to determine if the Fed will slow the pace of hikes moving forward!
Learn more about forex trading opportunities.
Related tags:

Open an account in minutes
Experience award-winning platforms with fast and secure execution, and enjoy tight spreads from 0.5 pts on FX and 0.3 pts on indices.
Economic calendar
Web Trader platform
Our sophisticated web-based platform is packed with features.
Related articles

USD/JPY weekly outlook: Quarter turn scrambles rates regime
USD/JPY’s tight relationship with front-end US rates broke down sharply last week, but quarter-turn flows and positioning suggest the disconnect may prove temporary.


Gold Update: XAU/USD Remains Under Pressure Even After the NFP Report
As the trading week comes to an end, weakness around gold price action remains evident in the short term. This can be seen in the performance of the past two sessions, where the metal has declined by approximately 0.3%. Although the move has not been particularly aggressive, it highlights that buying pressure continues to struggle to regain control of the market.


USD/CAD forecast: rally could accelerate above June highs at 1.4250
USD/CAD recovered quickly after weaker US jobs data, keeping the bullish trend in focus. A move above the June highs could accelerate the rally as inflation keeps the Fed under pressure.

This report is intended for general circulation only. It should not be construed as a recommendation, or an offer (or solicitation of an offer) to buy or sell any financial products. The information provided does not take into account your specific investment objectives, financial situation or particular needs. Before you act on any recommendation that may be contained in this report, independent advice ought to be sought from a financial adviser regarding the suitability of the investment product, taking into account your specific investment objectives, financial situation or particular needs.
StoneX Financial Pte. Ltd., may distribute reports produced by its respective foreign entities or affiliates within the StoneX group of companies or third parties pursuant to an arrangement under Regulation 32C of the Financial Advisers Regulations. Where the report is distributed to a person in Singapore who is not an accredited investor, expert investor or an institutional investor (as defined in the Securities Futures Act), StoneX Financial Pte. Ltd. accepts legal responsibility to such persons for the contents of the report only to the extent required by law. Singapore recipients should contact StoneX Financial Pte. Ltd. at 6826 9988 for matters arising from, or in connection with the report.
In the case of all other recipients of this report, to the extent permitted by applicable laws and regulations neither StoneX Financial Pte. Ltd. nor its associated companies will be responsible or liable for any loss or damage incurred arising out of, or in connection with, any use of the information contained in this report and all such liability is hereby expressly disclaimed. No representation or warranty is made, express or implied, that the content of this report is complete or accurate.
StoneX Financial Pte. Ltd. is not under any obligation to update this report.
Trading CFDs carries a high level of risk that may not be suitable for some investors. Consider your investment objectives, level of experience, financial resources, risk appetite and other relevant circumstances carefully. The possibility exists that you could lose some or all of your investments, including your initial deposits. If in doubt, please seek independent expert advice. Visit www.forex.com/en-sg/terms-and-policies for the complete Risk Disclosure Statement.