



USD/CNH Break Lower Could Target 7.0000
A descending triangle pattern is tightening its grip on USD/CNH. Will the next move be a sharp break toward 7.0000?
Share this:

- USD/CNH coiling near 7.1000 support
- Bearish momentum building, MACD confirms
- Break could target 7.0000 on triangle height
Summary
Is a possible reset in relations between the world’s two most powerful nations about to see the Chinese yuan strengthen sharply? USD/CNH is coiling in a descending triangle formation, and the risk of a break lower is arguably increasing—even if the reset proves short-lived.
USD/CNH Bears Eye Deeper Downside Move
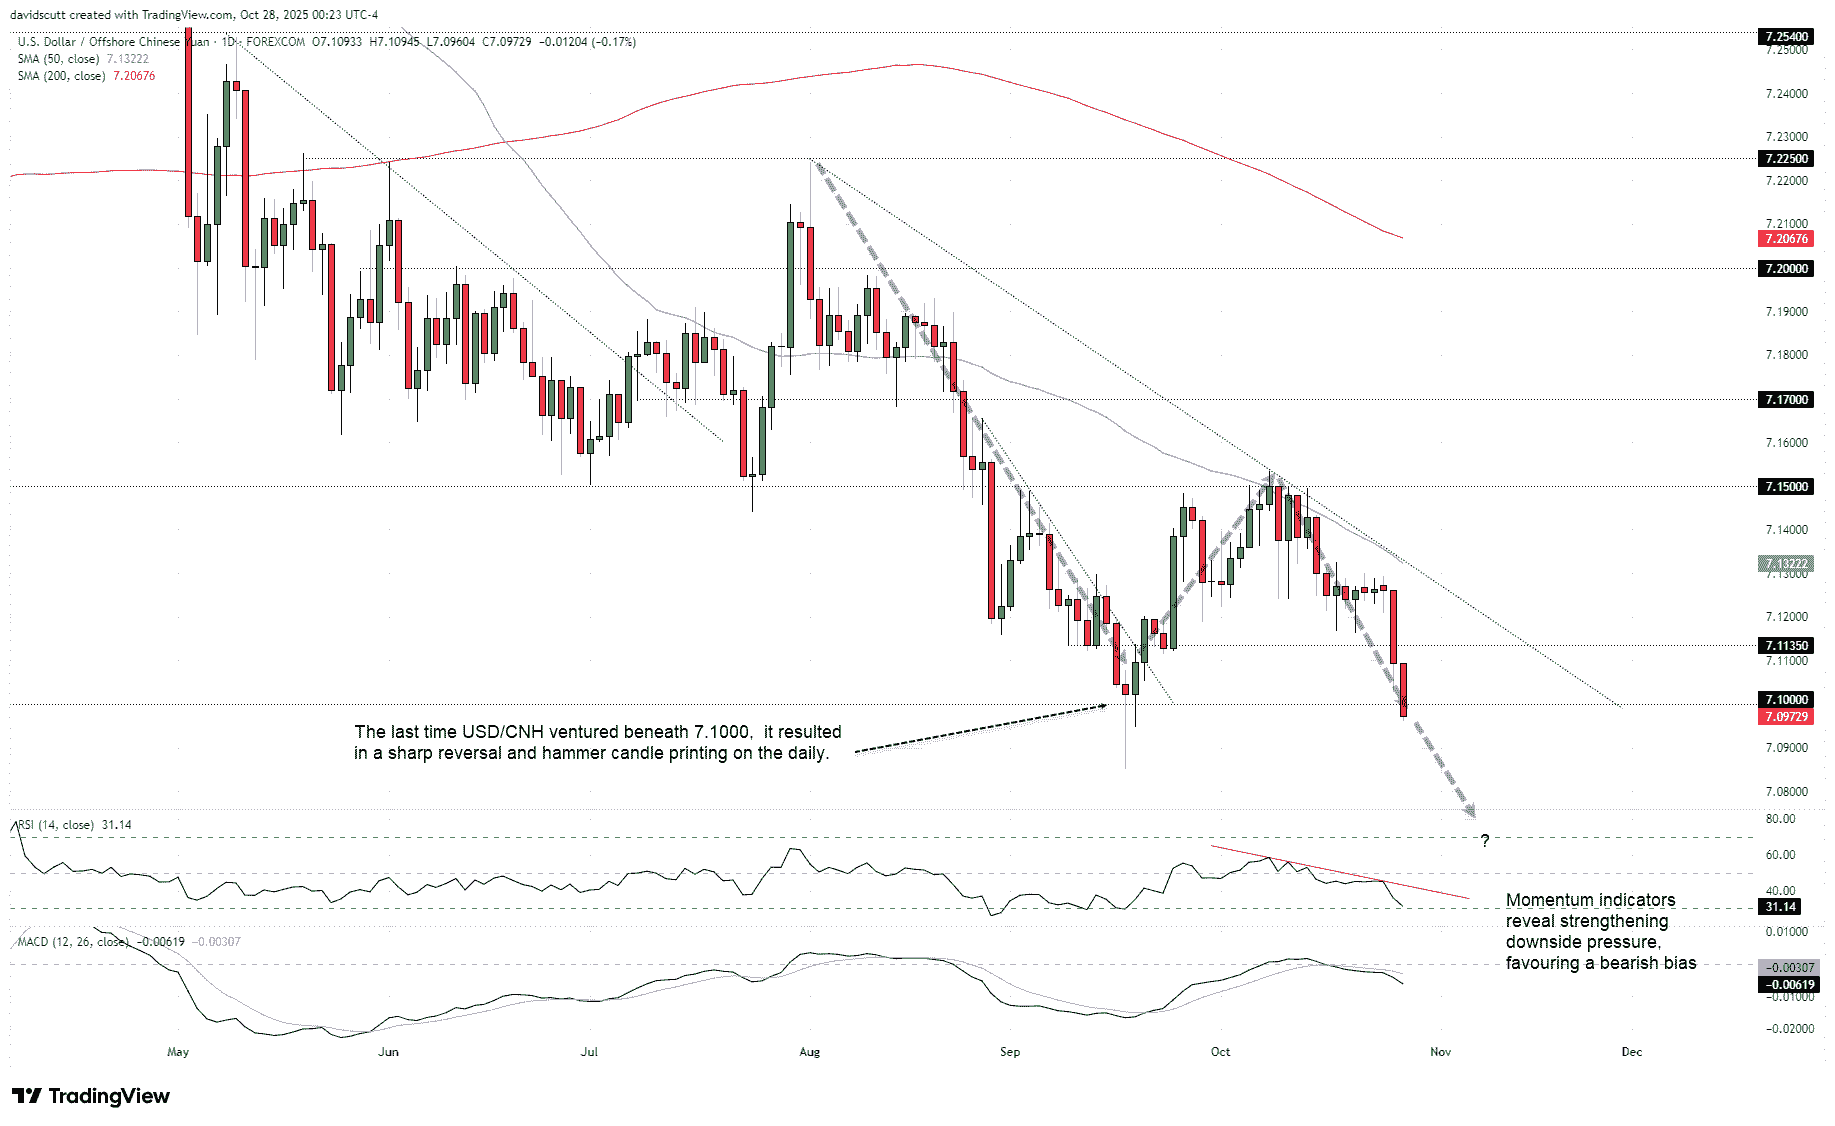
After breaking beneath the 50-day moving average on August 28, USD/CNH tried twice to reclaim the level earlier this month but failed to sustain the move. The pair has since resumed its push lower, leaving it teetering on support at 7.1000 today. The last time USD/CNH attempted to break beneath this level, it triggered a sharp reversal, printing a hammer candle on the daily chart that marked the start of a squeeze higher.
While that move failed, this one may have more success, arriving just before a likely trade deal between the U.S. and China on the sidelines of the APEC summit in South Korea later this week. There’s always the risk the framework reached on the weekend could unravel quickly, but the backdrop screens as supportive for the yuan: the Fed is widely expected to cut rates again while retaining a dovish bias, and risk appetite is strong across Asia.
Source: TradingView
Given the triangle pattern, a close beneath 7.1000 may spark a fresh wave of selling, putting the pair on track for a possible move toward the psychologically important 7.0000 level, based on the height of the triangle.
Shorts could be considered below 7.1000 with a stop above, targeting the September 17 low of 7.0850 initially. Beneath that, price action at 7.0600 and 7.0400 may provide clues as to whether the ultimate target of 7.0000 is likely to be reached.
Momentum indicators are generating strengthening bearish signals. RSI (14) is trending lower below 50 but is not yet oversold. MACD has confirmed by staging a bearish crossover of the signal line in negative territory, indicating downside pressure is building.


Related tags:


Open an account in minutes
Experience award-winning platforms with fast and secure execution, and enjoy tight spreads from 0.5 pts on FX and 0.3 pts on indices.
Economic calendar
Web Trader platform
Our sophisticated web-based platform is packed with features.
Related articles
Gold forecast: XAU/USD continues to coil as support holds again
Gold is being pulled in two directions by the same macro force: inflation. Persistent price pressures should, in theory, strengthen demand for the metal as a store of value. But if inflation proves sticky enough to keep central banks hawkish, the resulting rise in real and nominal yields makes gold less attractive at the margin.

Swiss Franc Technical Outlook: USD/CHF Reversal Puts Major Support in Focus 10 21 2026
USD/CHF bears are looking to build on last week’s sharp reversal, with a looming support test threatening the broader recovery.


Nasdaq 100 forecast: Stocks rebound ahead of more earnings
European indices recovered from a weaker start to turn positive by mid-morning trade, although US futures were still nursing small losses. Global indices were looking to add to their gains from the day before. Investors are weighing up encouraging earnings from SpaceX and Super Micro against elevated oil prices, which are limiting the upside for risk assets. We have more tech earnings coming up today which could shape the near-term Nasdaq 100 forecast.
This report is intended for general circulation only. It should not be construed as a recommendation, or an offer (or solicitation of an offer) to buy or sell any financial products. The information provided does not take into account your specific investment objectives, financial situation or particular needs. Before you act on any recommendation that may be contained in this report, independent advice ought to be sought from a financial adviser regarding the suitability of the investment product, taking into account your specific investment objectives, financial situation or particular needs.
StoneX Financial Pte. Ltd., may distribute reports produced by its respective foreign entities or affiliates within the StoneX group of companies or third parties pursuant to an arrangement under Regulation 32C of the Financial Advisers Regulations. Where the report is distributed to a person in Singapore who is not an accredited investor, expert investor or an institutional investor (as defined in the Securities Futures Act), StoneX Financial Pte. Ltd. accepts legal responsibility to such persons for the contents of the report only to the extent required by law. Singapore recipients should contact StoneX Financial Pte. Ltd. at 6826 9988 for matters arising from, or in connection with the report.
In the case of all other recipients of this report, to the extent permitted by applicable laws and regulations neither StoneX Financial Pte. Ltd. nor its associated companies will be responsible or liable for any loss or damage incurred arising out of, or in connection with, any use of the information contained in this report and all such liability is hereby expressly disclaimed. No representation or warranty is made, express or implied, that the content of this report is complete or accurate.
StoneX Financial Pte. Ltd. is not under any obligation to update this report.
Trading CFDs carries a high level of risk that may not be suitable for some investors. Consider your investment objectives, level of experience, financial resources, risk appetite and other relevant circumstances carefully. The possibility exists that you could lose some or all of your investments, including your initial deposits. If in doubt, please seek independent expert advice. Visit www.forex.com/en-sg/terms-and-policies for the complete Risk Disclosure Statement.