



USD/JPY Rally Tests Resistance Near Yearly Highs: EUR/JPY, GBP/JPY
US Dollar strength continued through the weekly open but the big question now is whether USD/JPY can muster a test of the vaulted psychological level of 160.00. Since the dizzying reversal in July of 2024 bulls haven’t dared to re-test that price since.
Share this:


Global markets remain in a vulnerable spot as tension in the Middle East has driven a strong shot of volatility with Oil prices as the primary push point. A massive gap in Crude Oil prices to start this week drove similar gaps across macro markets, with US equities selling off and the US Dollar rallying up to a familiar spot of resistance.
So far, those moves have backed off, helped along by the mention of drawing down the SPR which could bring a reasonable degree of relief to oil prices. But that relief is still young and as looked at in the oil article a little earlier today, bulls haven’t completely thrown in the towel yet as WTI is showing a massively overbought reading with daily RSI over the 90-level for the first time since August of 1990.
This is relevant to Japan and the Yen as Japan imports all their oil, and this inflationary pressure brings the prospect of higher prices on consumer products that make their way to their end destination with the necessity of oil. And higher oil prices can bring more than just higher prices at the gas pump, as that type of inflation can seep into several other consumer products and, in-turn, boost inflation for an economy.
We’ve already heard Kazuo Ueda threaten the prospect of more rate hikes should inflation continue higher and this has built expectation that we might see a rate hike in April. Given mounting macro volatility, however, those expectations might get pushed back for the Bank of Japan to avoid adding volatility to an already volatile backdrop, instead looking to make a move in June or July.
With that said, soft inflation readings released in February reduce some of the pressure that may otherwise be more pronounced, as Core CPI printed at a two-year low of 2.0%. The next iteration of that data point is on March 23rd and it’s the implication around energy prices that could bring near-term impact.
In USD/JPY, the rally has been noticeable since that inflation reading dropped on February 19th, which helped the pair to get back-above the 155.00 handle. Now the pair re-tests the resistance that held just after the New Year open, and around the same level that marked the 2025 high just a couple of weeks into last year.
USD/JPY Weekly Price Chart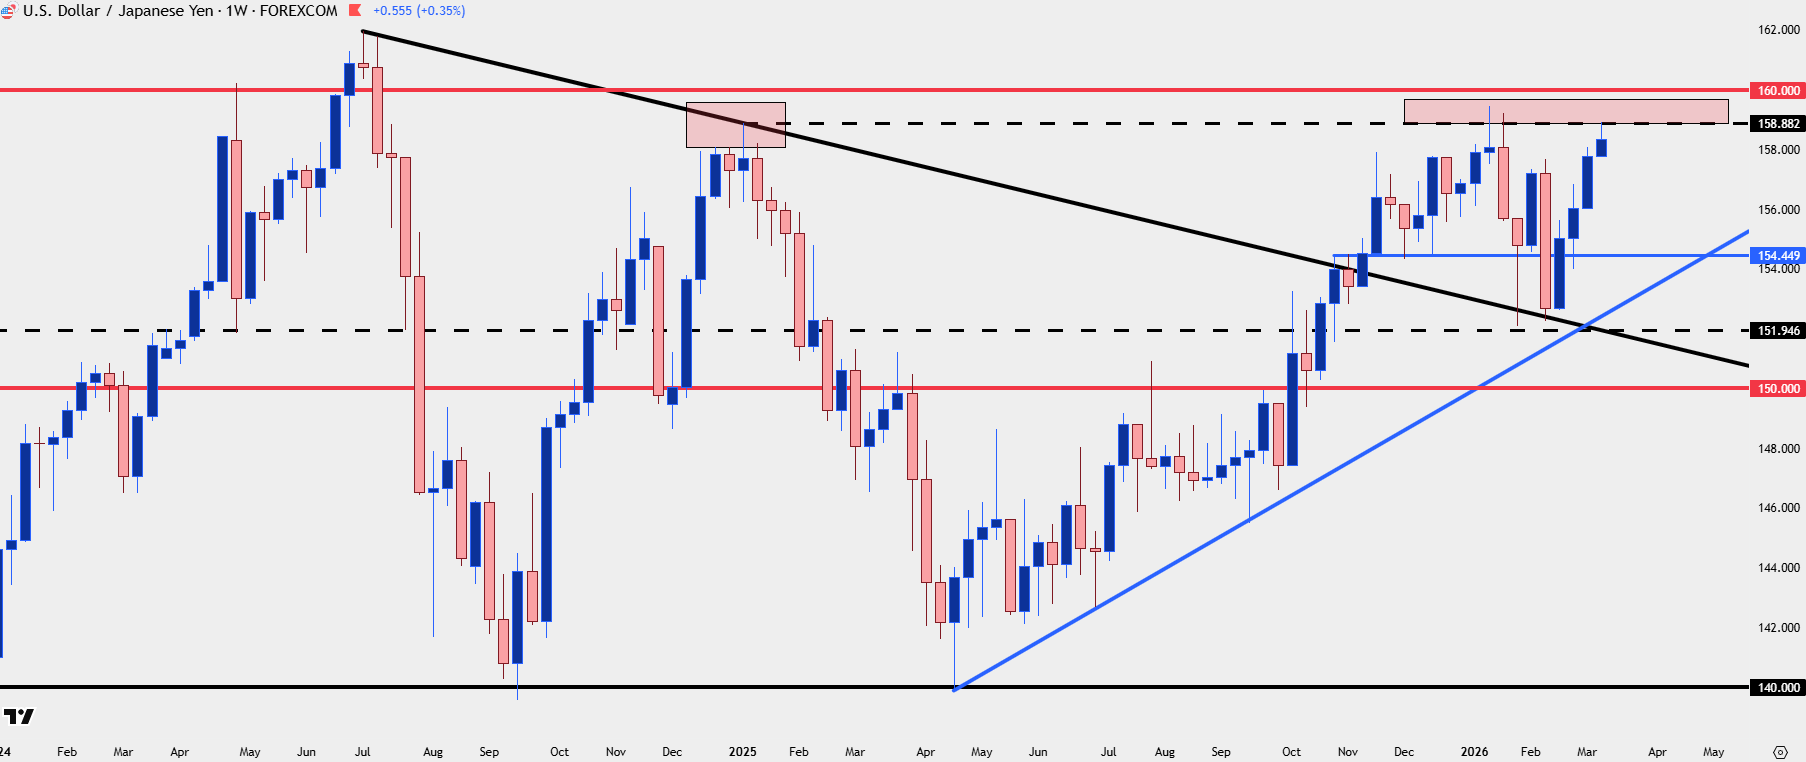
Chart prepared by James Stanley; data derived from Tradingview
USD/JPY Shorter-Term
The four-hour chart of USD/JPY shows a smooth and steady rally since the pullback in early-February, and from that structure a few different areas of note appear. We’re already seeing a test of support at prior resistance of 157.97, and below that is another prior higher-low around a spot of previous resistance at 156.76. Below that, it’s 155.53 before the 154.45-155.00 zone comes back into the equation and as I’ve been tracking in webinars and broader USD-strategy, that’s the key zone for bulls to hold on to in order to retain control.
USD/JPY Four-Hour Price Chart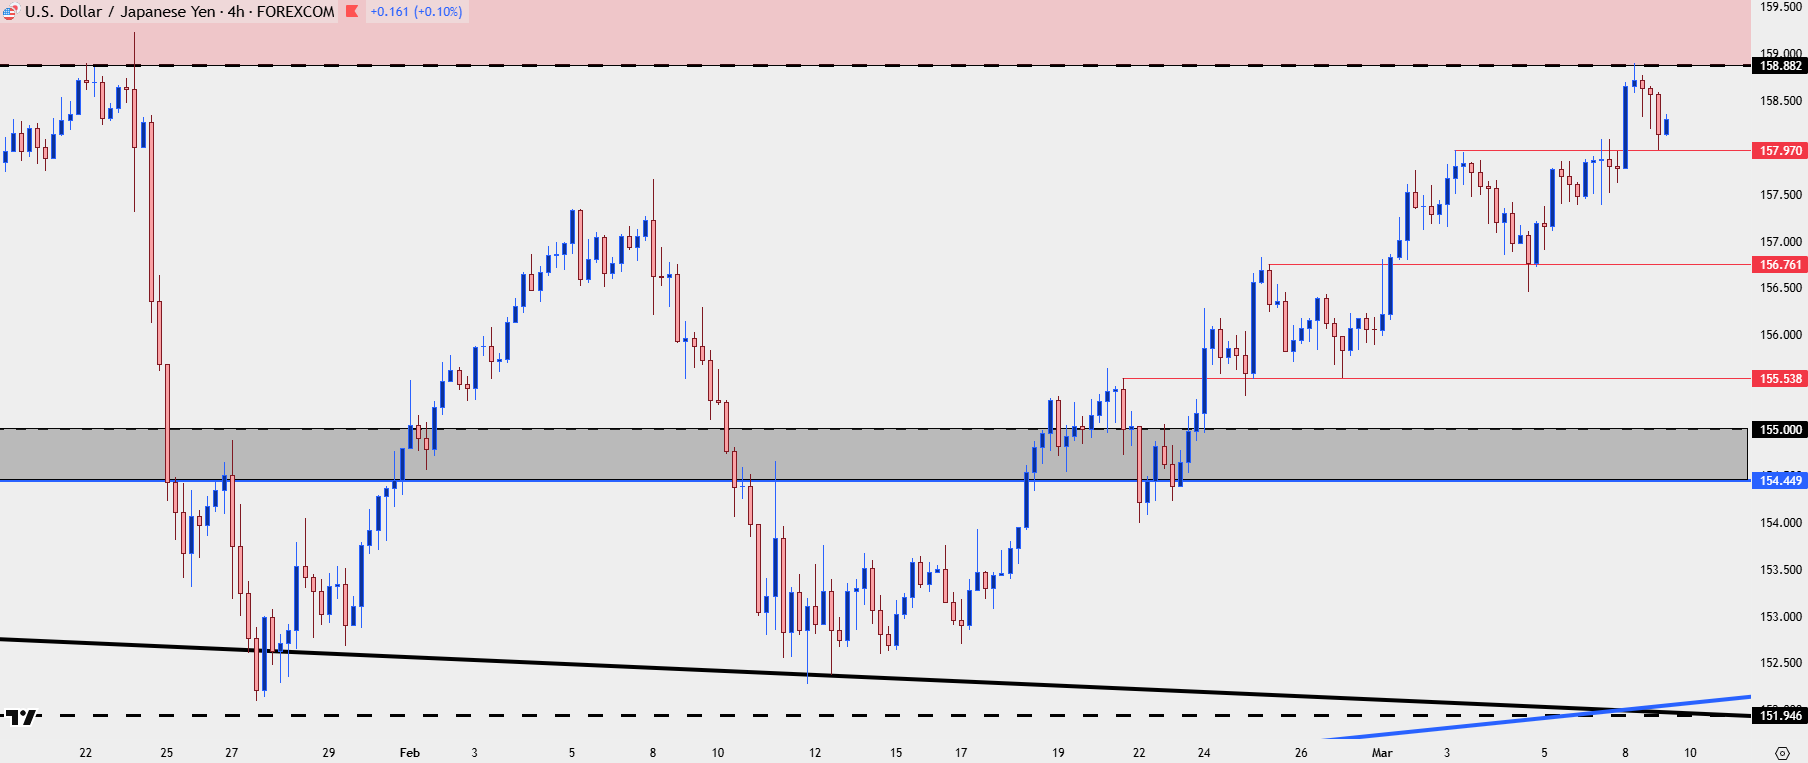
Chart prepared by James Stanley; data derived from Tradingview
JPY Away from the USD
The challenge with USD/JPY is two-fold in that both USD/JPY and DXY are running up to big spots of longer-term, bigger picture resistance. Of course given the turn of events on the macro side, there’s been a hit to both the Euro and the British Pound, but from a structural perspective, there could be an argument made for GBP/JPY as a more attractive bullish backdrop given the support hold around the 210.00 area last week.
At this point the pair is setup to test a bullish breakout around the 212.00 level, and the next significant spot of resistance overhead is the 214.30 level that held resistance multiple times followed by the 215.00 level above that.
GBP/JPY Daily Chart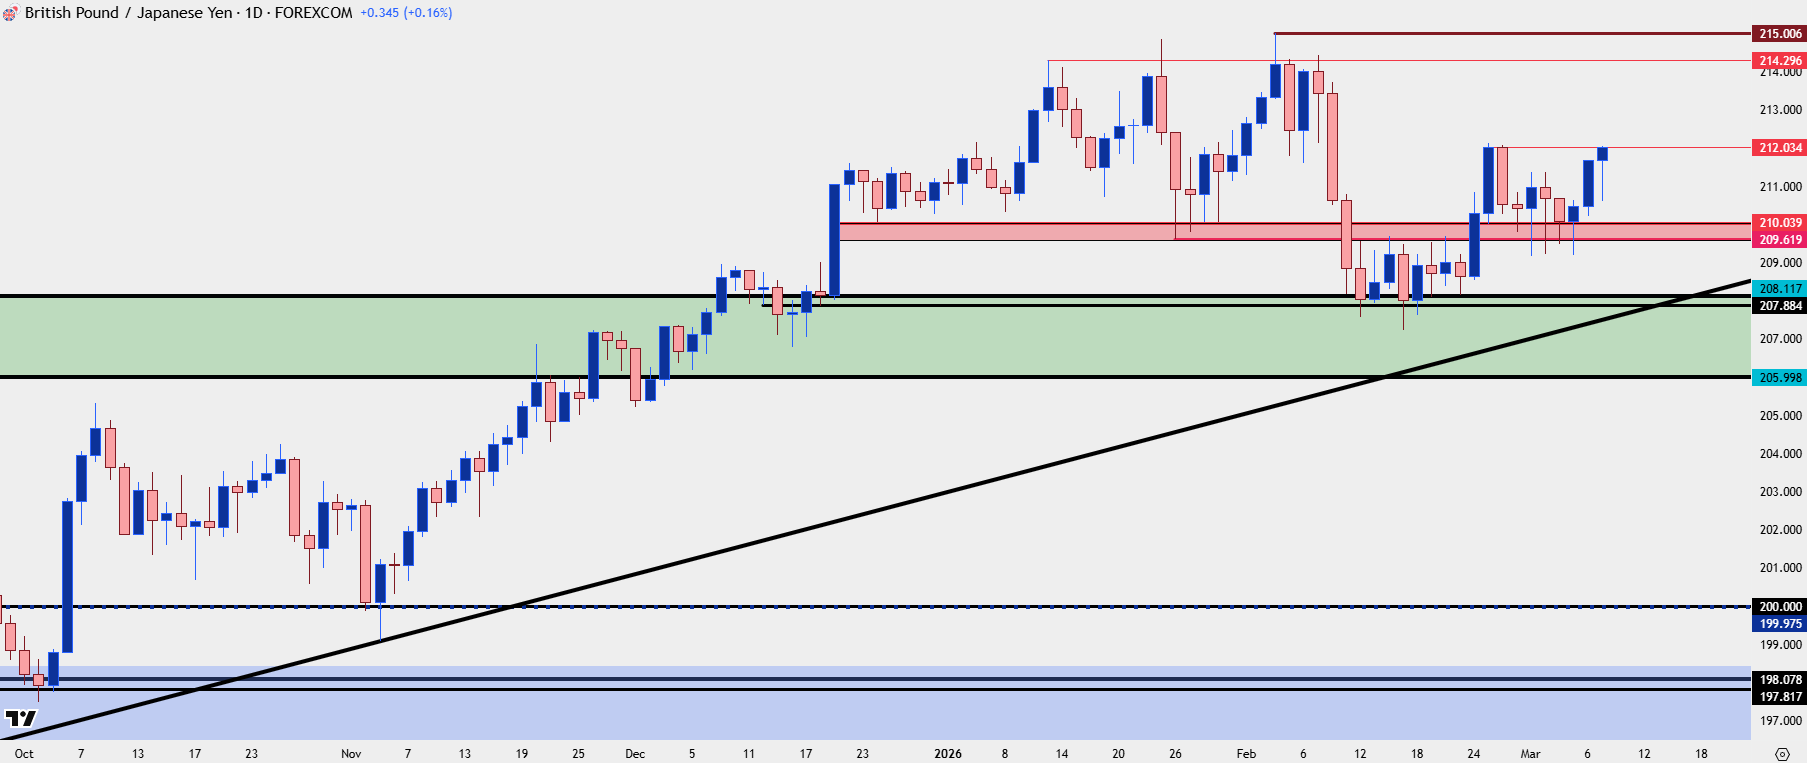
Chart prepared by James Stanley; data derived from Tradingview
EUR/JPY
From the daily chart I’m considering EUR/JPY as a bit less bullish than the above in GBP/JPY and there’s more of a consolidation-feel to the daily. But, so far, bulls have shown up at support of 182.00 and they can’t yet be ruled out as a breach of 183.80 opens the door for a test of 184.28 and then perhaps even the 185.00 level that’s been a major stumbling block for buyers so far in 2026.
EUR/JPY Daily Chart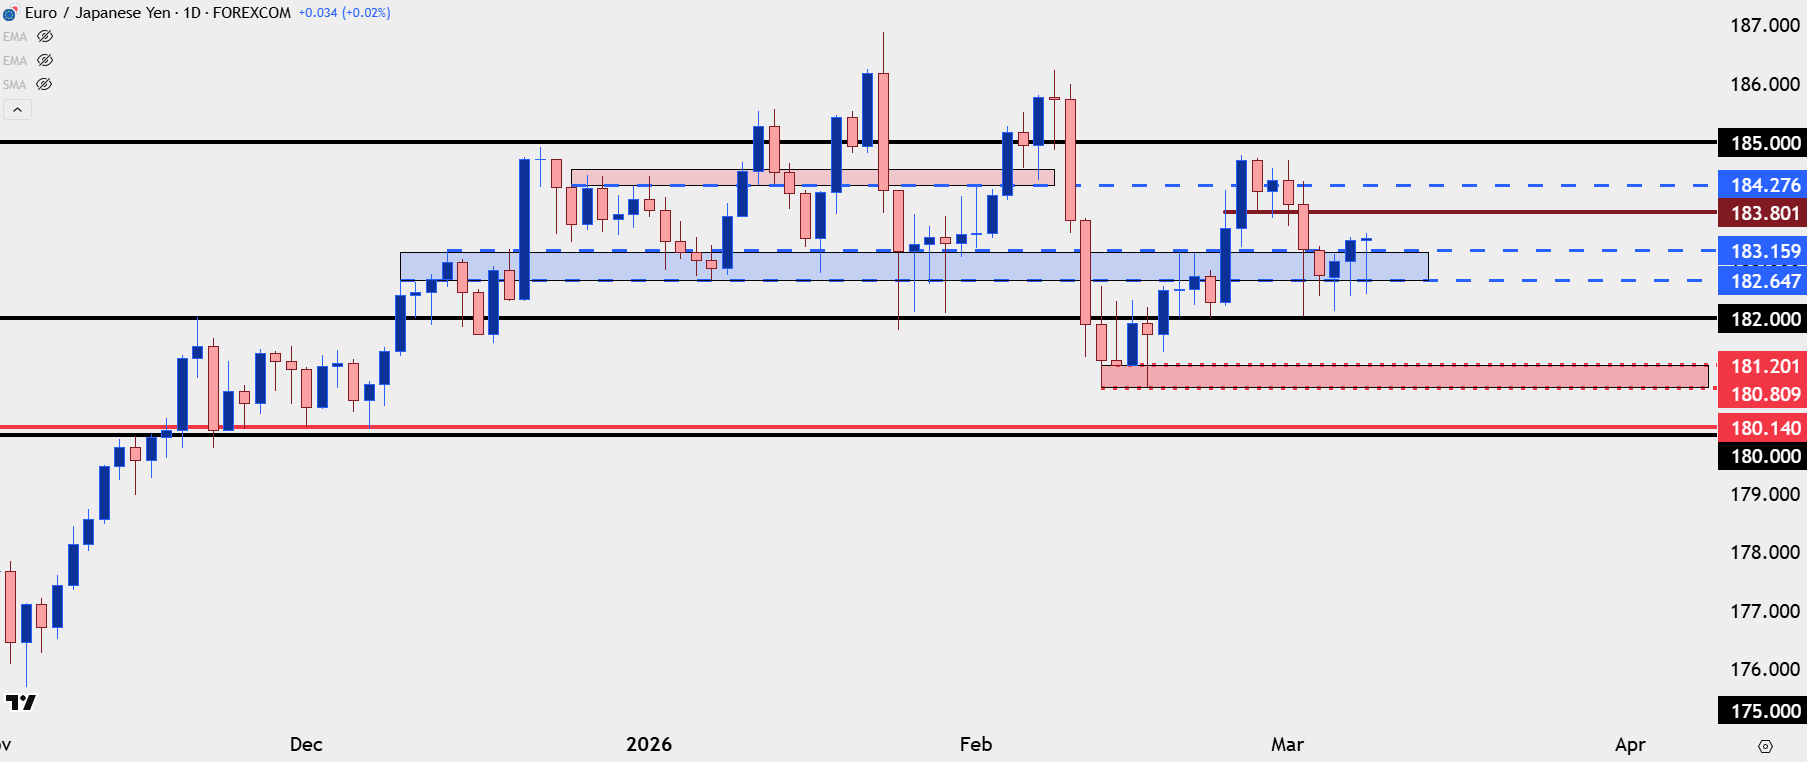
Chart prepared by James Stanley; data derived from Tradingview
--- written by James Stanley, Senior Market Analyst, Global Macro
Related tags:
Latest market news




Open an account in minutes
Experience award-winning platforms with fast and secure execution, and enjoy tight spreads from 0.5 pts on FX and 0.3 pts on indices.
Economic calendar
Web Trader platform
Our sophisticated web-based platform is packed with features.
Related articles
US Dollar Bears Lose Their Grip Ahead of NFP, USD/JPY Vols Elevated
US dollar selling pressure fades ahead of NFP as Fed hike bets retreat. USD/JPY stands out with a 141-pip implied move as FX volatility takes centre stage.

NFP Preview: New Government, Same Jobs Market?
Traders are still sifting through the fallout of the US midterm elections, just in time to get hit with another volatility: The monthly Non-Farm Payrolls (NFP) report - what will the jobs report show, and what could it mean for the US dollar?


US dollar outlook: Nasdaq breakdown raises stakes for EUR/USD, USD/JPY
A potential Democratic sweep of Congress is adding to the AI trade's headaches, with Nasdaq 100 futures breaking below a major technical level. The implications for the dollar could be significant.
This report is intended for general circulation only. It should not be construed as a recommendation, or an offer (or solicitation of an offer) to buy or sell any financial products. The information provided does not take into account your specific investment objectives, financial situation or particular needs. Before you act on any recommendation that may be contained in this report, independent advice ought to be sought from a financial adviser regarding the suitability of the investment product, taking into account your specific investment objectives, financial situation or particular needs.
StoneX Financial Pte. Ltd., may distribute reports produced by its respective foreign entities or affiliates within the StoneX group of companies or third parties pursuant to an arrangement under Regulation 32C of the Financial Advisers Regulations. Where the report is distributed to a person in Singapore who is not an accredited investor, expert investor or an institutional investor (as defined in the Securities Futures Act), StoneX Financial Pte. Ltd. accepts legal responsibility to such persons for the contents of the report only to the extent required by law. Singapore recipients should contact StoneX Financial Pte. Ltd. at 6826 9988 for matters arising from, or in connection with the report.
In the case of all other recipients of this report, to the extent permitted by applicable laws and regulations neither StoneX Financial Pte. Ltd. nor its associated companies will be responsible or liable for any loss or damage incurred arising out of, or in connection with, any use of the information contained in this report and all such liability is hereby expressly disclaimed. No representation or warranty is made, express or implied, that the content of this report is complete or accurate.
StoneX Financial Pte. Ltd. is not under any obligation to update this report.
Trading CFDs carries a high level of risk that may not be suitable for some investors. Consider your investment objectives, level of experience, financial resources, risk appetite and other relevant circumstances carefully. The possibility exists that you could lose some or all of your investments, including your initial deposits. If in doubt, please seek independent expert advice. Visit www.forex.com/en-sg/terms-and-policies for the complete Risk Disclosure Statement.