



USD Price Action Setups After the Breakout: EUR/USD, USD/JPY, Gold
The ascending triangle in USD broke out in a big way, like the prior week breakout from the same formation in gold. But with DXY hitting a spot of resistance, is now the time to adjust?
Share this:

Motion creates emotion and the massive rally in the US Dollar has certainly created several headlines that add a bit of noise to the matter. In the effort of balance, I tried to look at setups on either side of the matter for this webinar and highlighted both gold and EUR/USD shorter-term setups.
In the US Dollar, the ascending triangle that I’ve been following broke out in a big way to start this week, and already bulls have pushed price up to resistance at the 99.50 level.
The next resistance overhead is a major spot – the same that held back buyers three separate times last year in August and then twice in November. If bulls can break above that, we can see some pretty major shifts in markets like stocks and gold but, for now, that’s overhead resistance. And support is the 97.94 Fibonacci level that held the highs in the ascending triangle before this week’s breakout.
US Dollar Four-Hour Price Chart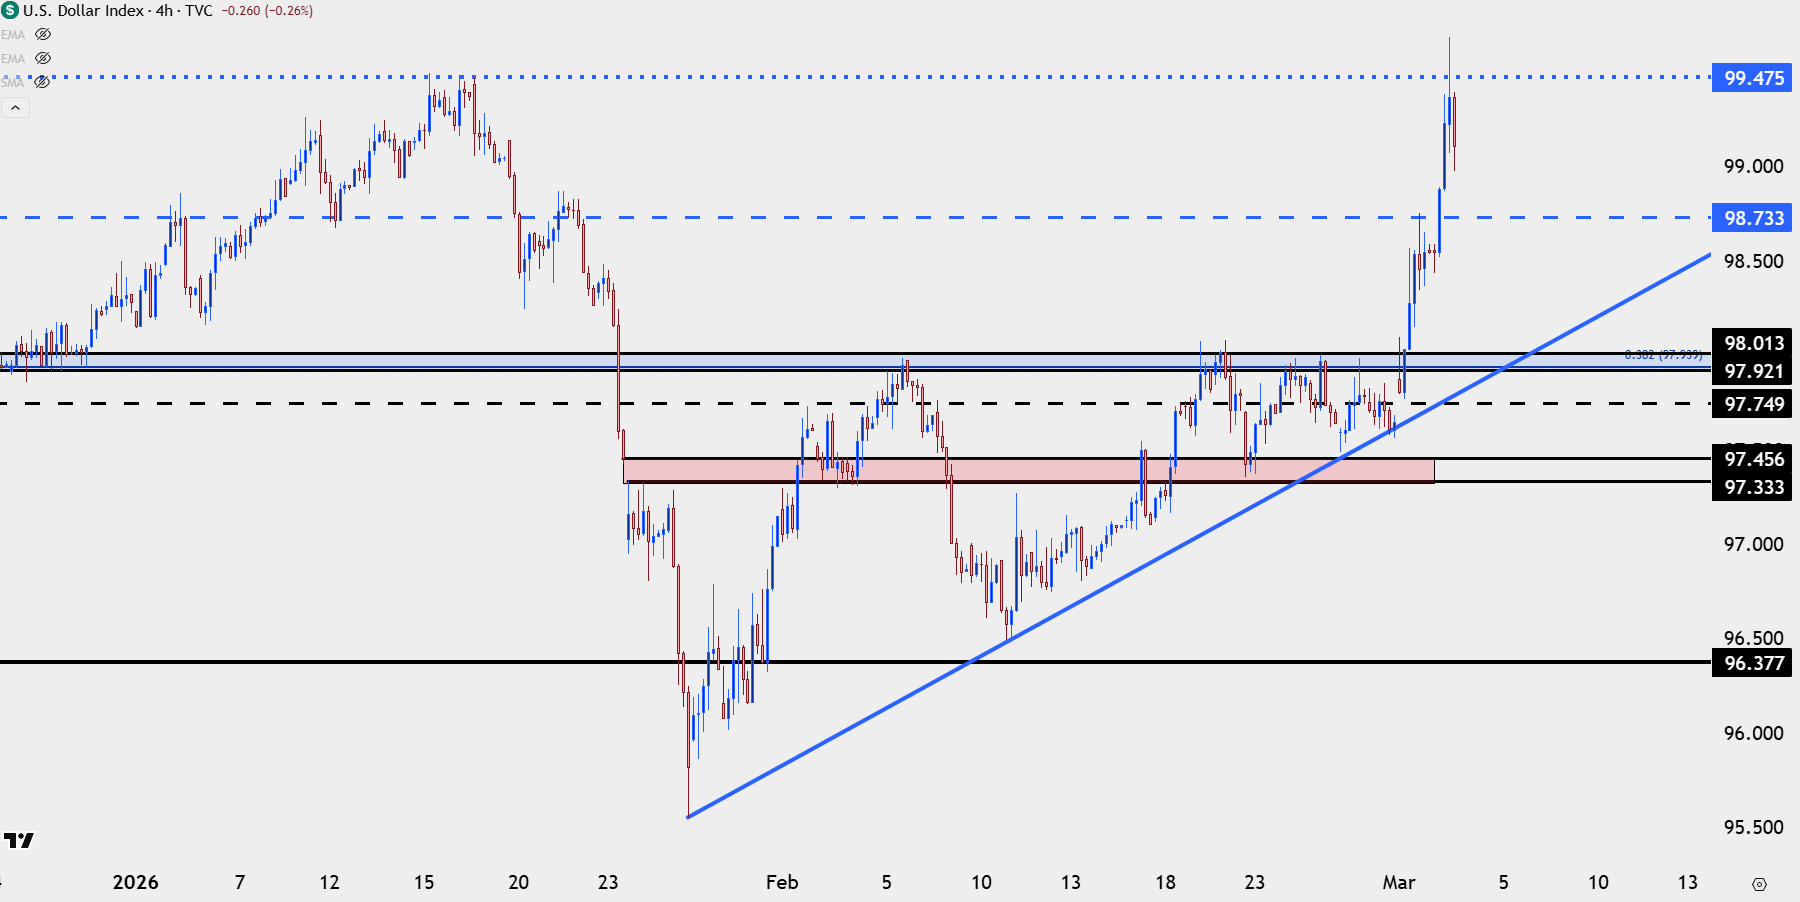
Chart prepared by James Stanley; data derived from Tradingview

EUR/USD Takes Over on USD
While USD/JPY has seemed to be a main push point for the US Dollar and the DXY basket as a whole of late, it’s the breakdown in EUR/USD that’s seemed to have the bigger push on the US Dollar so far this week.
As shared in the webinar I think this roots from the way the US has went about attacks in Iran, as this is yet another step away from the US-NATO relationship and something that takes a bit of importance away from the Euro.
That said, this is all still very early and the thesis that many are espousing, how higher energy prices are at the source of the move, doesn’t quite fit as higher energy prices are likely to boost inflation expectations which, in turn, remove some of the ECB’s ability to cut rates.
Nonetheless, price is price, and EUR/USD seems to be trying to find it’s footing and while this doesn’t necessarily suggest full-fledged reversal, it does open the door for a pullback and a test of a lower-high. For that lower-high potential, it’s the Fibonacci level at 1.1686 that stands out with the prior support of 1.1748 sitting above that.
EUR/USD Four-Hour Chart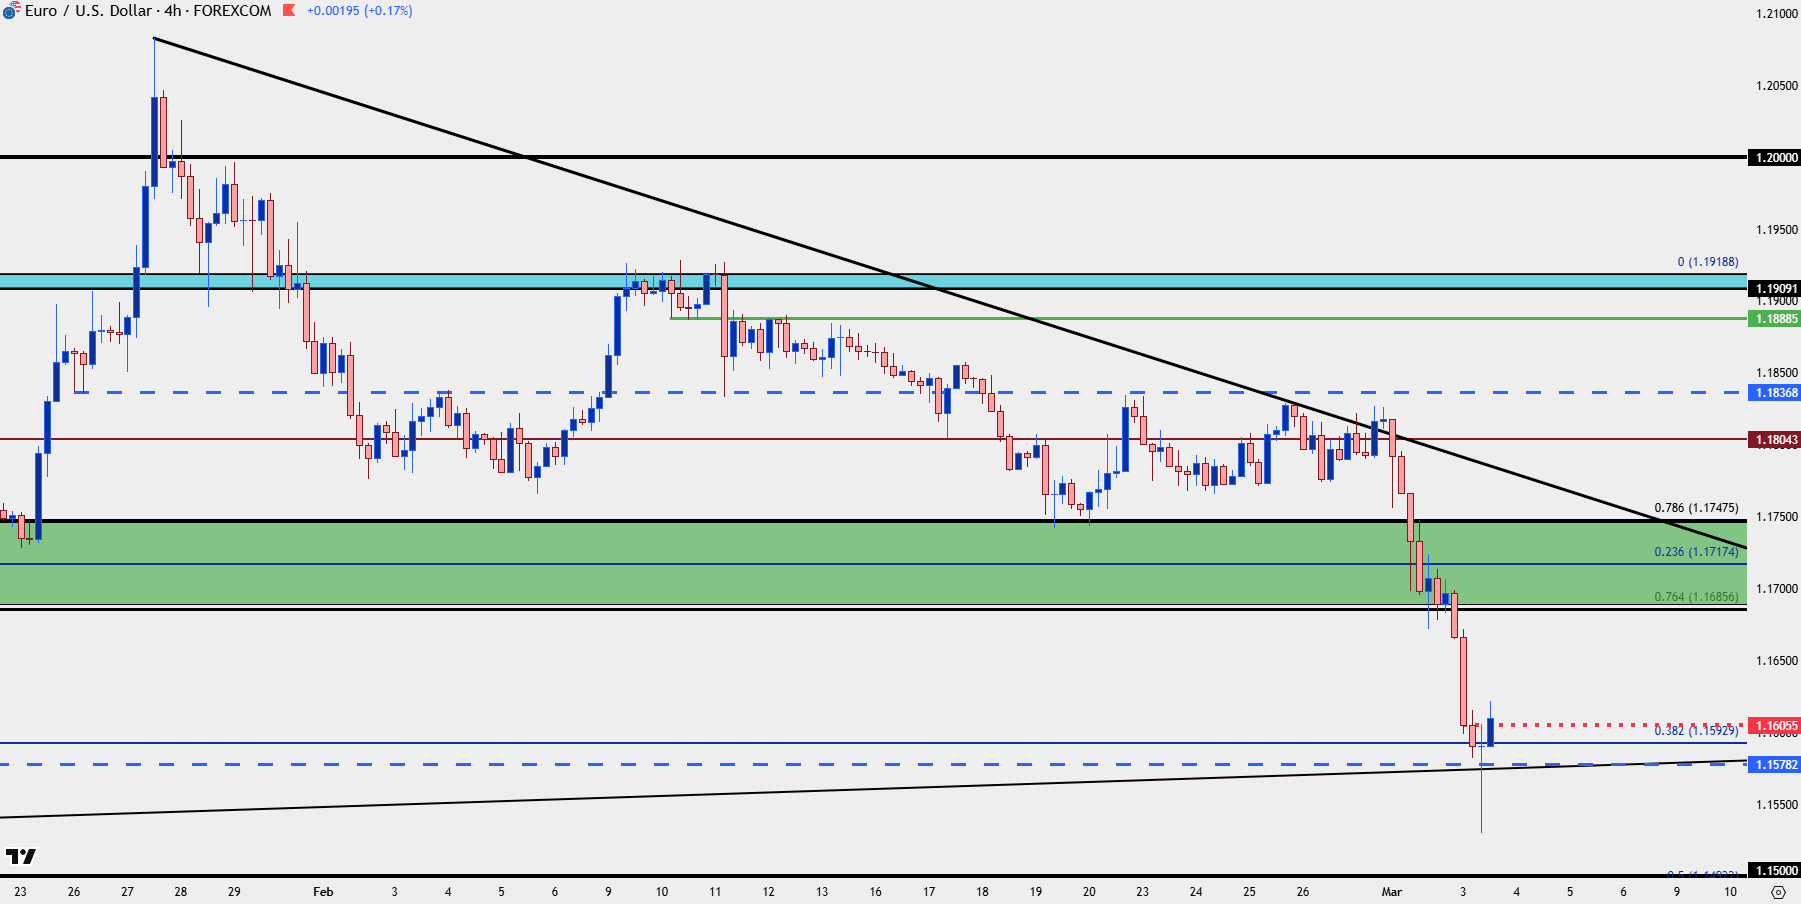
Chart prepared by James Stanley; data derived from Tradingview
GBP/USD
Cable was similarly hit hard and negated the falling wedge formation that had held into last week’s close, but so far the 1.3250 level has stood up as support. The 1.3414-1.3434 levels now produce a zone for lower-high resistance, and this is what bulls would need to take out to make a more convincing drive for a bullish reversal.
GBP/USD Four-Hour Chart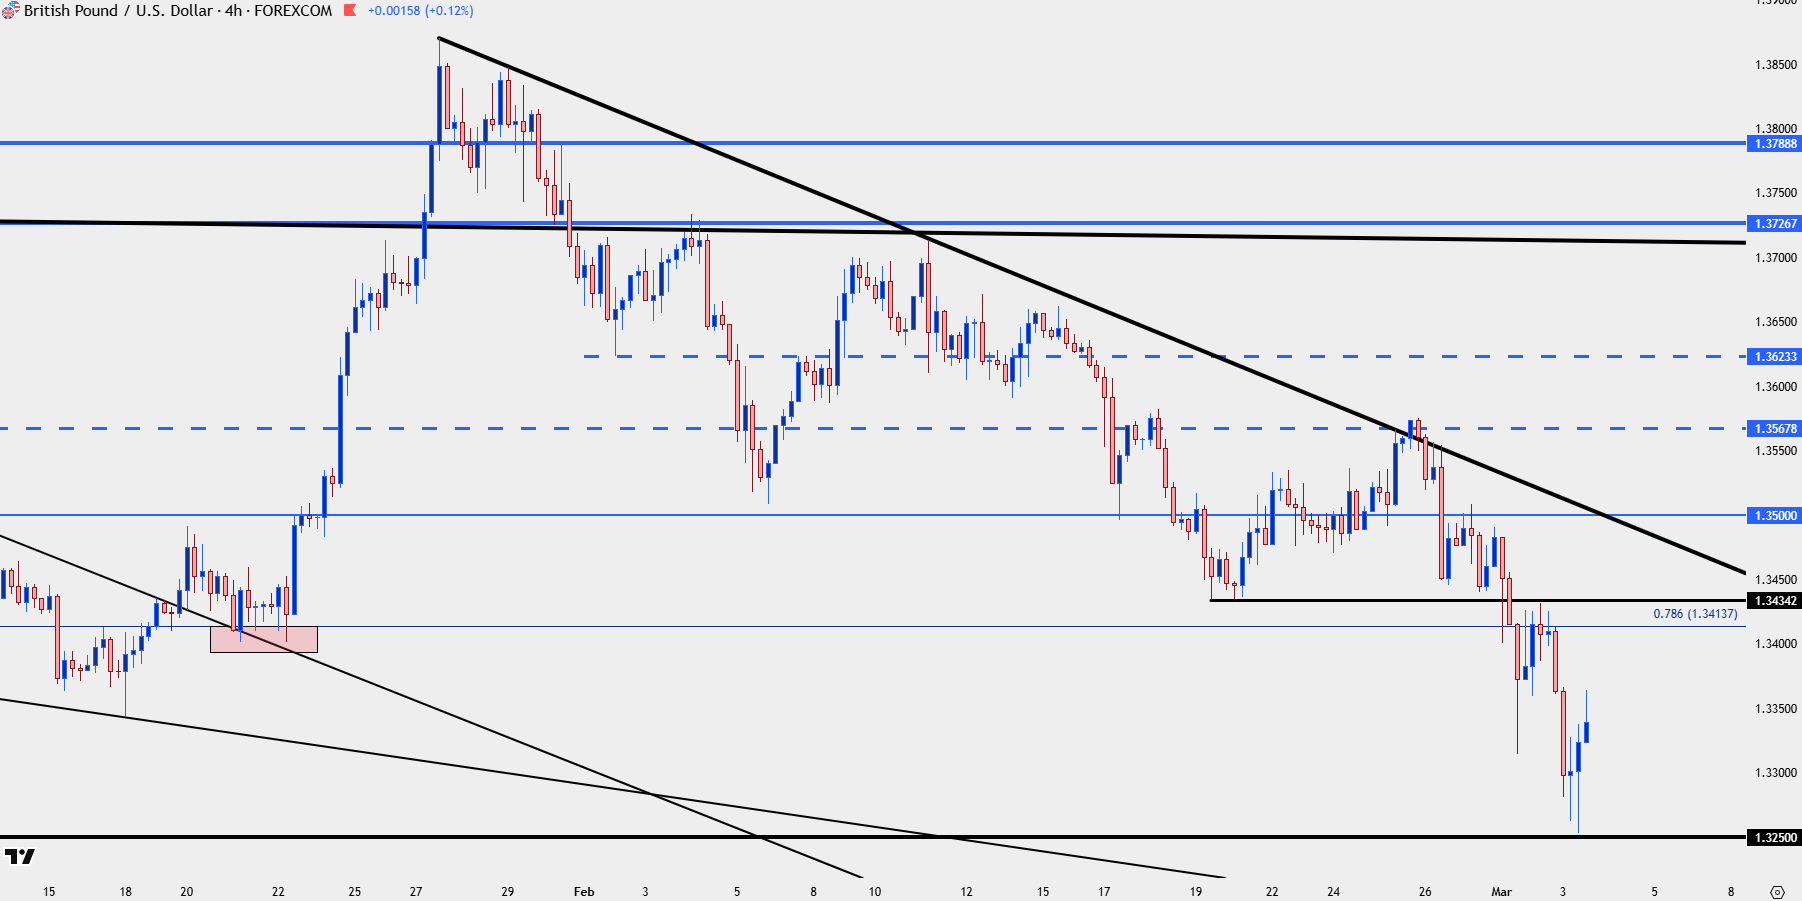
Chart prepared by James Stanley; data derived from Tradingview

USD/JPY
While the unfurling of the Euro has been a big push point for the USD, it’s the Japanese Yen that could unsettle the trend. The pair is now testing the same highs that held resistance in February and just overhead are a couple of spots that so far bulls haven’t had much success with, and these post right around the 159.00 level with the 160.00 level lurking above that.
Like we saw in late-January, a reversal in USD/JPY can have an outsized impact on the DXY basket and that can, in-turn, push pairs like EUR/USD and GBP/USD.
For now, the short-term trend remains bullish and there’s higher-low support potential at 156.27, 154.45-155.00 and then 153.67. If the 151.95-152.50 zone gets taken out we can be looking at a remarkably different picture very soon.
USD/JPY Daily Chart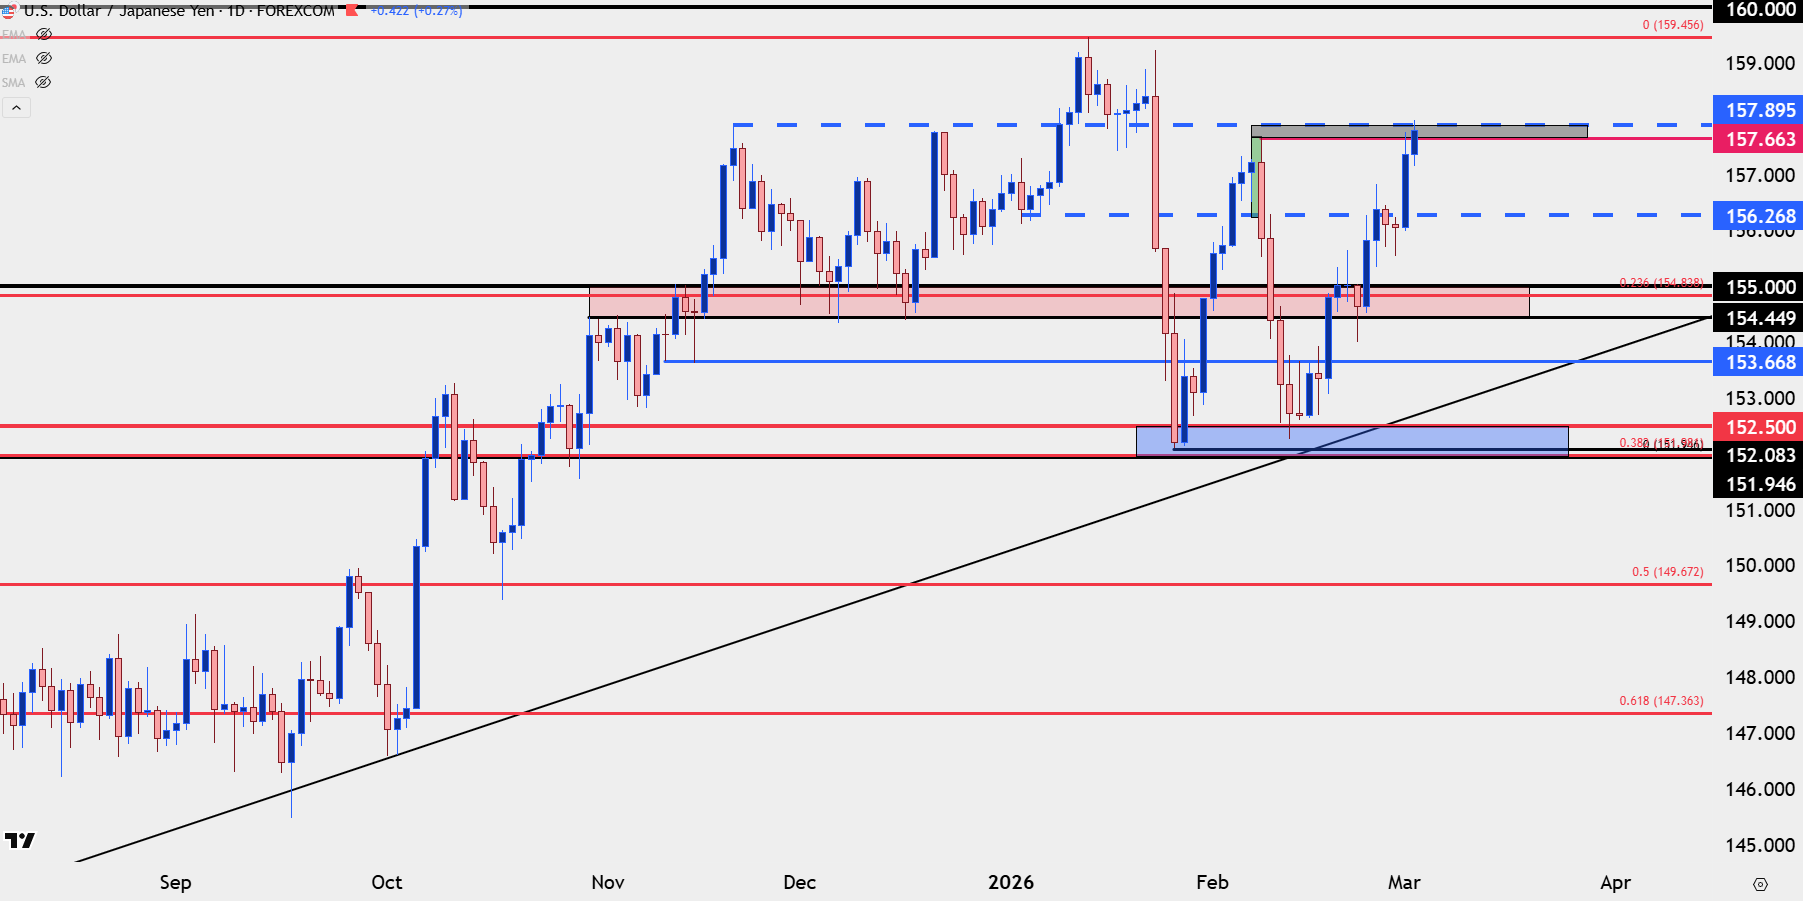
Chart prepared by James Stanley; data derived from Tradingview
Gold
Gold started off the week with strength, but prices have peeled back aggressively so far today. So far, the 5k level has held the lows and as shown in the webinar, it’s the 5100 area that sets up for possible higher-low support which remains in-play as of this writing.
Gold 30-Minute Chart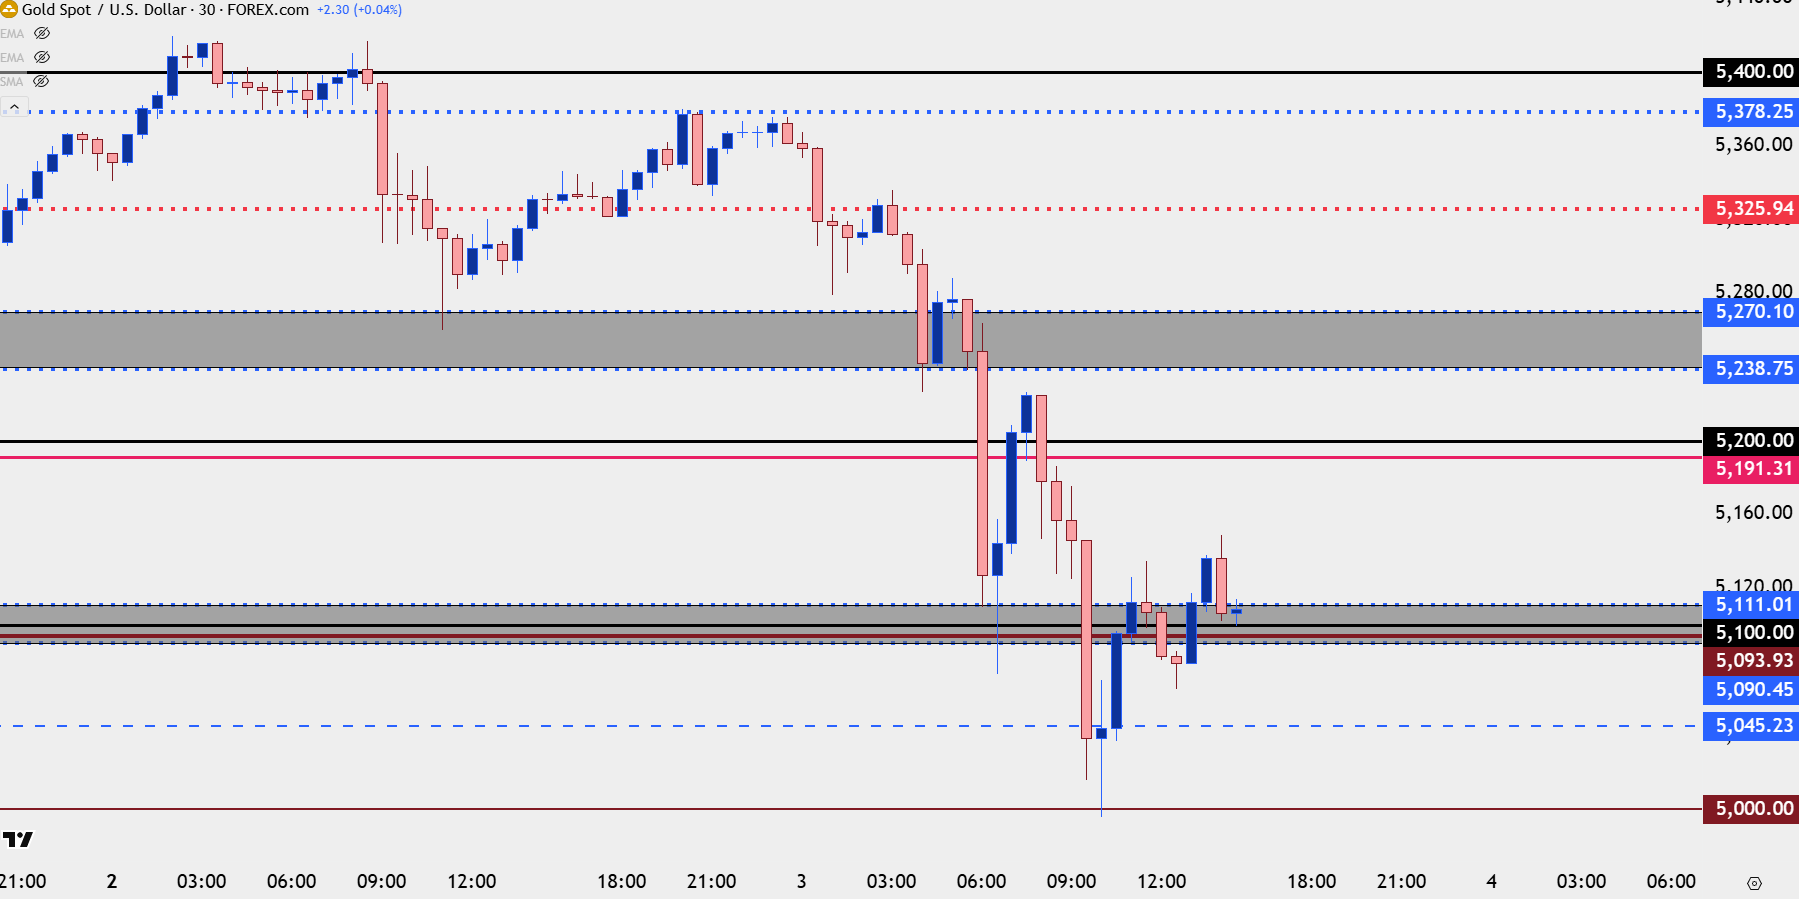
Chart prepared by James Stanley; data derived from Tradingview
--- written by James Stanley, Senior Market Analyst, Global Macro


Open an account in minutes
Experience award-winning platforms with fast and secure execution, and enjoy tight spreads from 0.5 pts on FX and 0.3 pts on indices.
Economic calendar
Web Trader platform
Our sophisticated web-based platform is packed with features.
Related articles
USD/JPY weekly outlook: Quarter turn scrambles rates regime
USD/JPY’s tight relationship with front-end US rates broke down sharply last week, but quarter-turn flows and positioning suggest the disconnect may prove temporary.

Gold Update: XAU/USD Remains Under Pressure Even After the NFP Report
As the trading week comes to an end, weakness around gold price action remains evident in the short term. This can be seen in the performance of the past two sessions, where the metal has declined by approximately 0.3%. Although the move has not been particularly aggressive, it highlights that buying pressure continues to struggle to regain control of the market.


USD Sets Fresh Yearly High as EUR/USD Drops Dramatically, USD/JPY Stable
Well, it was a week of USD strength that wasn’t entirely pushed by USD/JPY, as a strong sell-off in EUR/USD has pushed the major pair to its most oversold state in a decade.
This report is intended for general circulation only. It should not be construed as a recommendation, or an offer (or solicitation of an offer) to buy or sell any financial products. The information provided does not take into account your specific investment objectives, financial situation or particular needs. Before you act on any recommendation that may be contained in this report, independent advice ought to be sought from a financial adviser regarding the suitability of the investment product, taking into account your specific investment objectives, financial situation or particular needs.
StoneX Financial Pte. Ltd., may distribute reports produced by its respective foreign entities or affiliates within the StoneX group of companies or third parties pursuant to an arrangement under Regulation 32C of the Financial Advisers Regulations. Where the report is distributed to a person in Singapore who is not an accredited investor, expert investor or an institutional investor (as defined in the Securities Futures Act), StoneX Financial Pte. Ltd. accepts legal responsibility to such persons for the contents of the report only to the extent required by law. Singapore recipients should contact StoneX Financial Pte. Ltd. at 6826 9988 for matters arising from, or in connection with the report.
In the case of all other recipients of this report, to the extent permitted by applicable laws and regulations neither StoneX Financial Pte. Ltd. nor its associated companies will be responsible or liable for any loss or damage incurred arising out of, or in connection with, any use of the information contained in this report and all such liability is hereby expressly disclaimed. No representation or warranty is made, express or implied, that the content of this report is complete or accurate.
StoneX Financial Pte. Ltd. is not under any obligation to update this report.
Trading CFDs carries a high level of risk that may not be suitable for some investors. Consider your investment objectives, level of experience, financial resources, risk appetite and other relevant circumstances carefully. The possibility exists that you could lose some or all of your investments, including your initial deposits. If in doubt, please seek independent expert advice. Visit www.forex.com/en-sg/terms-and-policies for the complete Risk Disclosure Statement.