



USDCAD, EURUSD Price Outlook: Long-Term Setups Emerge as DXY Tests 13-Month Highs
USDCAD and EURUSD Price Outlook: DXY tests 13-month highs as major currency pairs approach key long-term support and resistance levels.
Share this:

Long-term setups are emerging across major currency pairs as the US Dollar Index (DXY) extends its rally toward fresh 13-month highs.
Signs of overbought daily momentum, last seen in March 2026 and previously throughout 2025, are now appearing across several major dollar-related charts:
- US Dollar Index (DXY): Trading near 13-month highs with overbought daily RSI readings. U.S. Dollar Strength Tests Conviction as Bond Markets Split on Direction
- USDJPY: Trading near 162 and multi-decade highs with overbought daily RSI conditions. USDJPY Price Forecast: Could a Hawkish Fed Trigger a Breakout Toward 180?
- USDCAD: Trading near 1.42 and 14-month highs with overbought daily RSI readings.
Overbought conditions are not necessarily sell signals, particularly when weekly and monthly timeframes continue to suggest room for further gains before reaching historical extremes. However, as these trends approach critical technical levels, traders should remain alert to short-term consolidation, profit taking, or pullback risks that may create attractive longer-term opportunities.
Meanwhile, EURUSD is testing daily oversold conditions last seen in March 2026 and previously in 2025. At the same time, monthly RSI readings are approaching the neutral 50 level from above, raising the possibility of a short-term rebound as the pair tests a major multi-year support zone.
What Are the Key Scenarios to Watch?
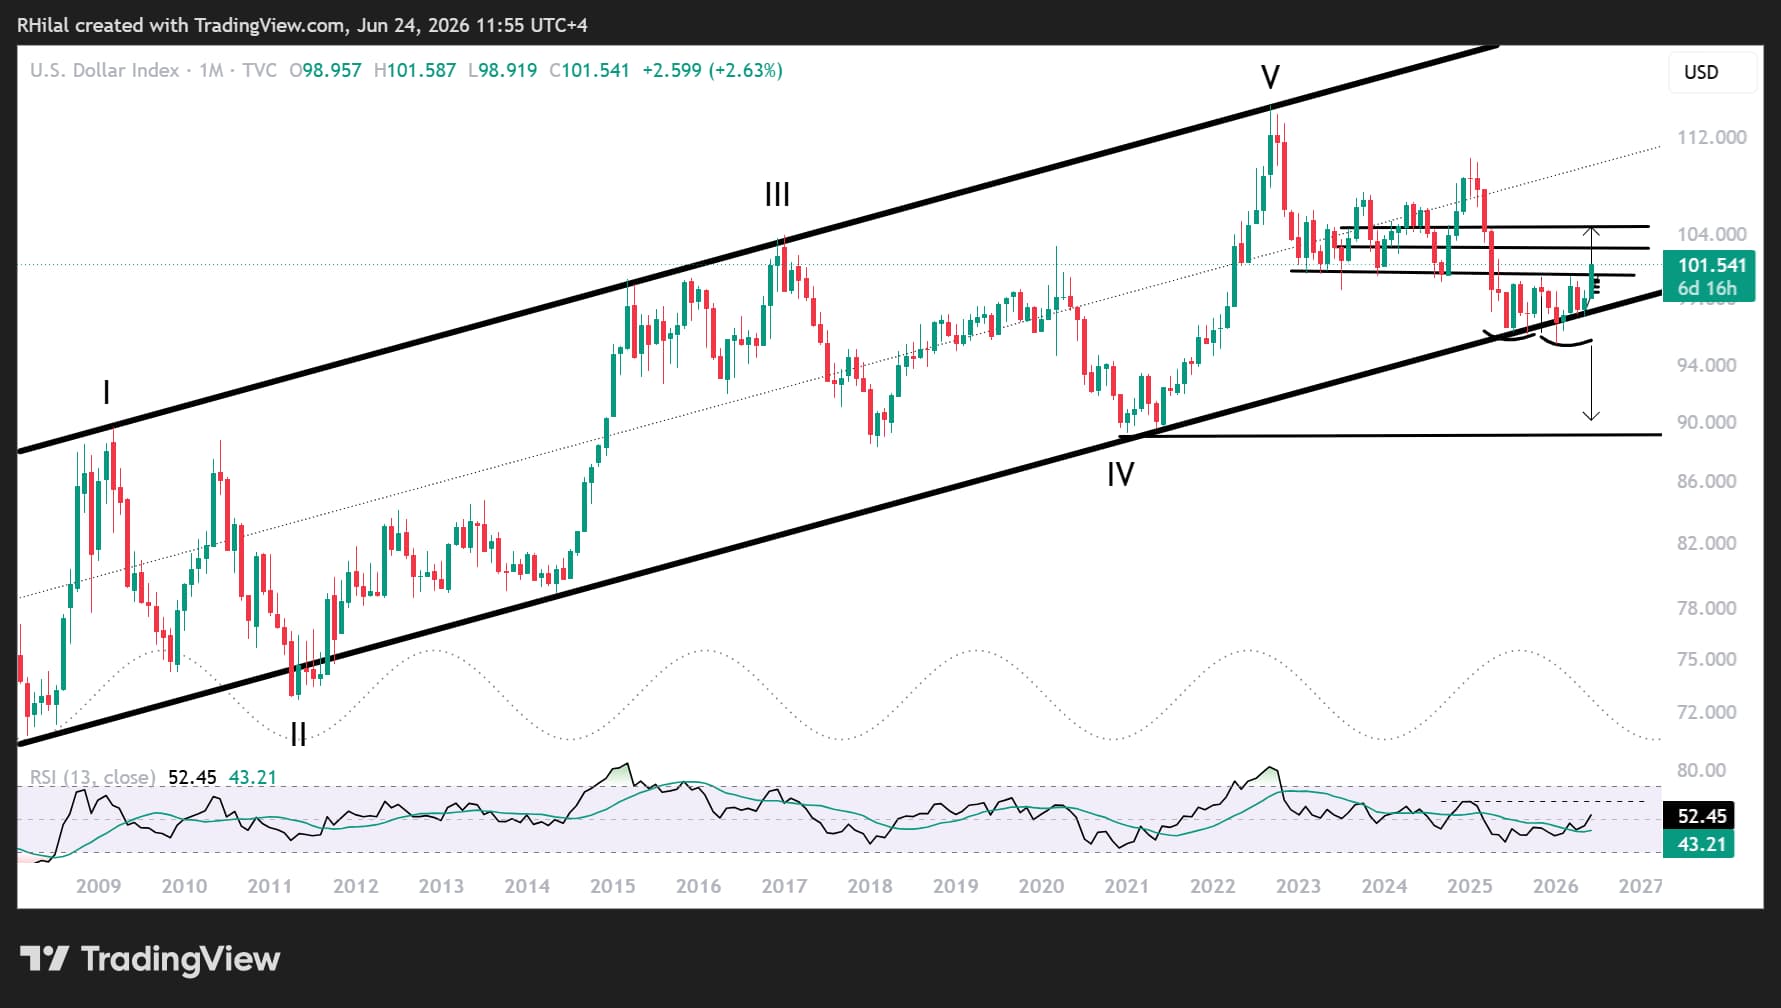
DXY Price Outlook: Monthly Time Frame – Log Scale
Source: TradingView
Why the 101.20 Zone Matters
As the old saying goes, the trend is your friend.
The DXY has respected a rising trend structure since 2008 and is now testing:
- A multi-year support-turned-resistance zone near 101 that has been in place since 2022.
- The 38.2% Fibonacci retracement of the decline between the 2025 high and the 2026 low.
- The potential neckline of a double-bottom formation developing throughout the past year.
A sustained breakout above 101.20 would expose the next major Fibonacci resistance levels near:
- 102.80 (50%)
- 104.50 (61.8%)
This scenario could accelerate downside pressure on EURUSD toward 1.1280 while supporting a continuation higher in USDCAD toward 1.45.
On the downside, DXY would need to break below 100.20 and then 99.30 to re-establish a short-term bearish outlook, potentially supporting a recovery in major currencies and precious metals.
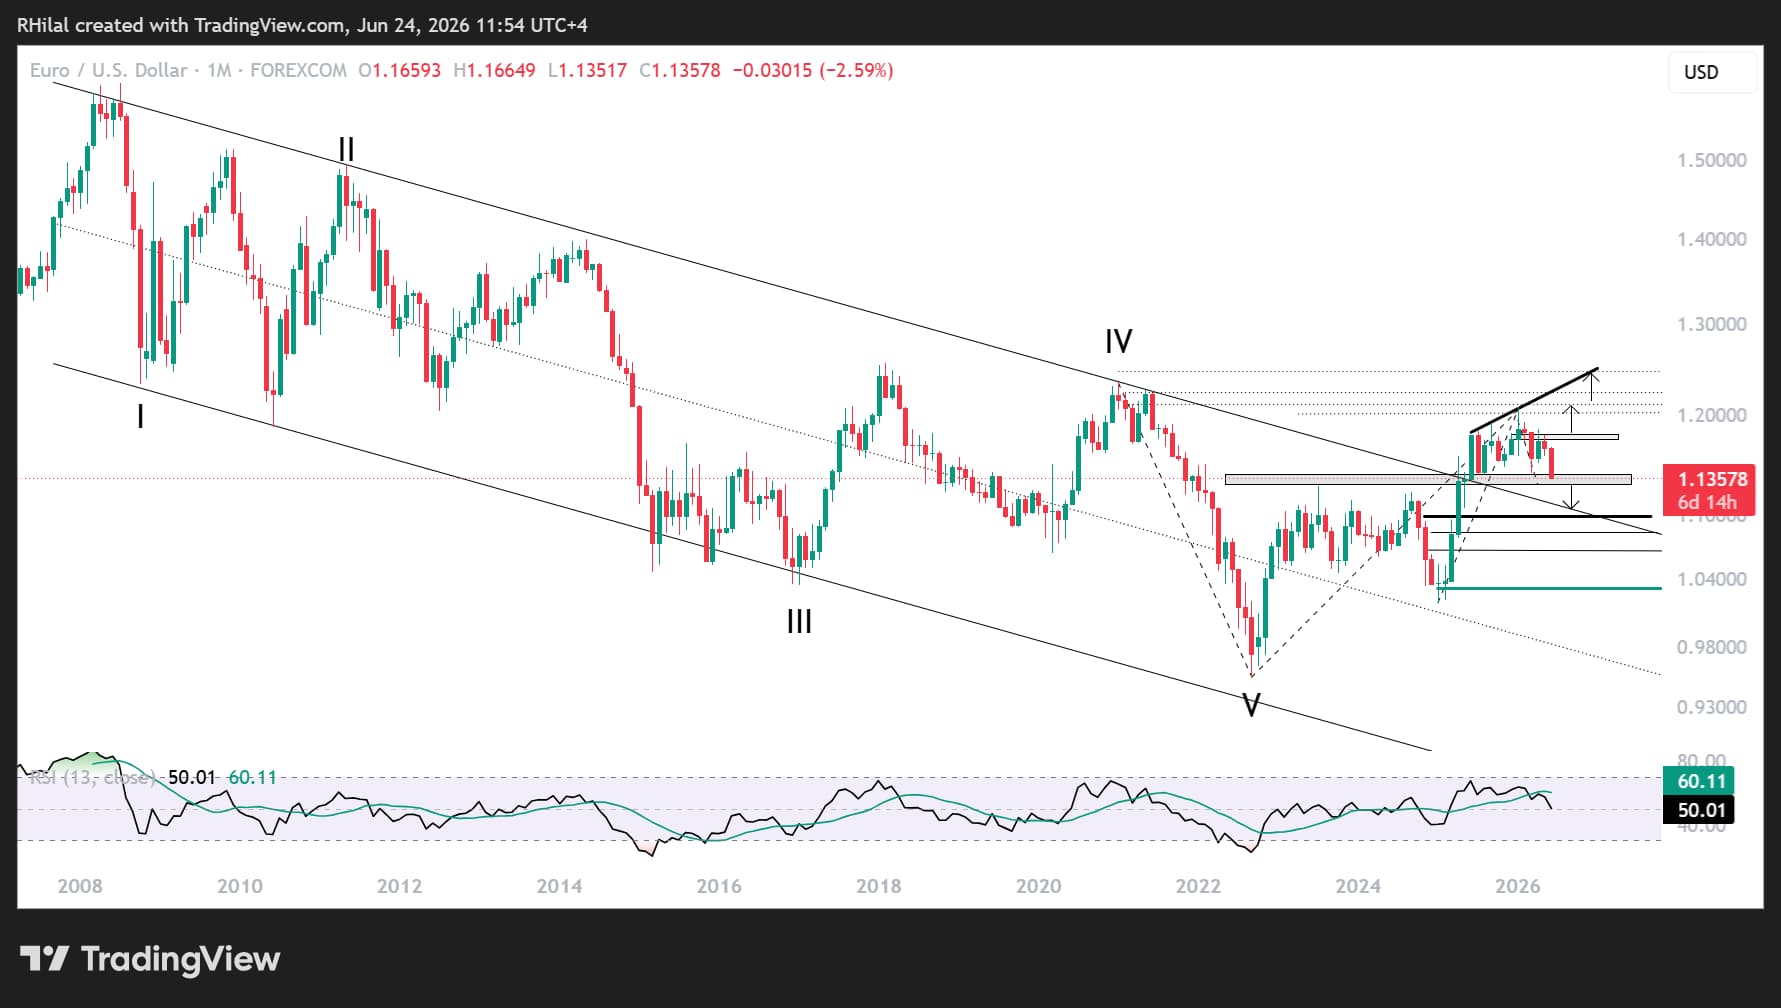
EURUSD Price Outlook: Monthly Time Frame – Log Scale
Source: TradingView
EURUSD Tests a Critical Multi-Year Support Zone
The EURUSD pair is currently testing a critical multi-year support zone between 1.1400 and 1.1280.
This area previously acted as resistance throughout 2023 and 2024 before turning into support during 2025 and 2026.
The zone also aligns with the 23.6% and 27.2% Fibonacci extension levels of the broader trend connecting the 2021 high, the 2022 low, and the 2026 high.
Combined with yearly oversold daily momentum readings and neutral monthly momentum conditions, the pair is approaching a potentially decisive technical inflection point.
Bearish Scenario – Breakdown Below 1.1280
A breakdown below 1.1280 would expose the upper boundary of the long-term descending channel that guided price action between 2008 and 2024, as well as the 38.2% Fibonacci extension near 1.10.
This region may provide another attractive long-term accumulation opportunity.
Bullish Scenario – Recovery Above 1.1430 and 1.1630
A rebound above 1.1430 and 1.1630 would bring the key 1.18 resistance zone back into focus.
A sustained breakout above this level could confirm a longer-term bullish continuation toward the trendline connecting major highs between 2025 and 2026 near 1.2240, broadly aligning with the 2021 highs.
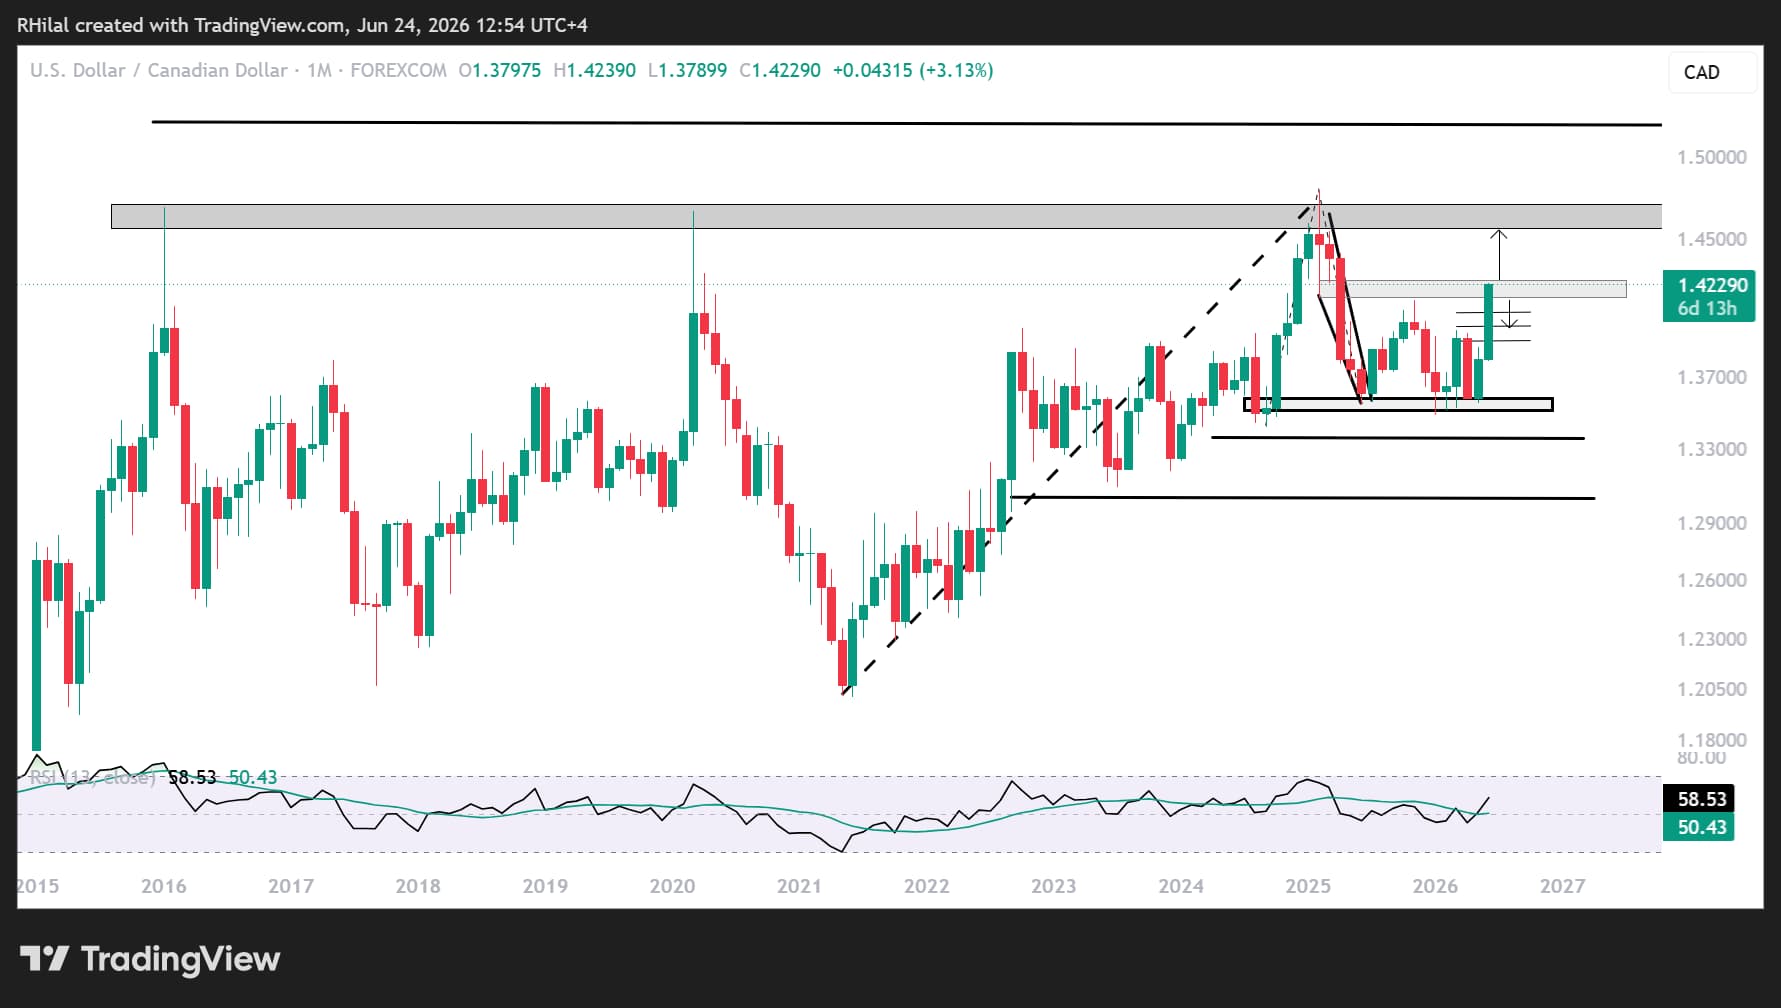
USDCAD Price Outlook: Monthly Time Frame – Log Scale
Source: TradingView
USDCAD Faces Critical 1.4250 Resistance
USDCAD is currently testing the 23.6%–27.2% Fibonacci extension zone near 1.4250, derived from the broader trend connecting the 2021 low, the 2025 high, and the 2026 low.
Bullish Scenario – Sustained Hold Above 1.4250
A sustained hold above 1.4250, accompanied by continued positive RSI momentum on the monthly timeframe, could extend the rally toward the major resistance zone between:
- 1.4550
- 1.4700
This region has capped advances repeatedly since 2016 and may present another significant pullback risk.
Beyond that, the 161.8% Fibonacci extension points toward the psychological 1.50 level as the next major target and long term resistance.
Bearish Scenario – Reversal Below 1.41
Given the steepness of the recent advance, a reversal below 1.41 could trigger profit-taking activity and expose downside targets between:
- 1.3980
- 1.3900
These levels may determine whether a new rebound emerges or whether the pair extends losses back toward the yearly lows.
DXY Remains the Key Driver
With DXY testing fresh 13-month highs and markets continuing to price elevated odds of further Federal Reserve tightening, USDCAD and EURUSD are approaching major long-term technical levels.
The coming US economic releases may prove decisive. If incoming data continues to support a higher-for-longer interest rate environment, dollar strength could persist and accelerate current trends.
Conversely, any signs that rate hike expectations have become fully priced into markets may increase the probability of short-term pullbacks and consolidation across major currency pairs.
For now, traders should focus on confirmation at the key levels highlighted above, as they may determine the next major long-term opportunities in both EURUSD and USDCAD.
Written by Razan Hilal, CMT
Follow on X: @Rh_waves
Related tags:

Open an account in minutes
Experience award-winning platforms with fast and secure execution, and enjoy tight spreads from 0.5 pts on FX and 0.3 pts on indices.
Economic calendar
Web Trader platform
Our sophisticated web-based platform is packed with features.
Related articles

USD/JPY weekly outlook: Quarter turn scrambles rates regime
USD/JPY’s tight relationship with front-end US rates broke down sharply last week, but quarter-turn flows and positioning suggest the disconnect may prove temporary.


USD/CAD forecast: rally could accelerate above June highs at 1.4250
USD/CAD recovered quickly after weaker US jobs data, keeping the bullish trend in focus. A move above the June highs could accelerate the rally as inflation keeps the Fed under pressure.


USD Sets Fresh Yearly High as EUR/USD Drops Dramatically, USD/JPY Stable
Well, it was a week of USD strength that wasn’t entirely pushed by USD/JPY, as a strong sell-off in EUR/USD has pushed the major pair to its most oversold state in a decade.
This report is intended for general circulation only. It should not be construed as a recommendation, or an offer (or solicitation of an offer) to buy or sell any financial products. The information provided does not take into account your specific investment objectives, financial situation or particular needs. Before you act on any recommendation that may be contained in this report, independent advice ought to be sought from a financial adviser regarding the suitability of the investment product, taking into account your specific investment objectives, financial situation or particular needs.
StoneX Financial Pte. Ltd., may distribute reports produced by its respective foreign entities or affiliates within the StoneX group of companies or third parties pursuant to an arrangement under Regulation 32C of the Financial Advisers Regulations. Where the report is distributed to a person in Singapore who is not an accredited investor, expert investor or an institutional investor (as defined in the Securities Futures Act), StoneX Financial Pte. Ltd. accepts legal responsibility to such persons for the contents of the report only to the extent required by law. Singapore recipients should contact StoneX Financial Pte. Ltd. at 6826 9988 for matters arising from, or in connection with the report.
In the case of all other recipients of this report, to the extent permitted by applicable laws and regulations neither StoneX Financial Pte. Ltd. nor its associated companies will be responsible or liable for any loss or damage incurred arising out of, or in connection with, any use of the information contained in this report and all such liability is hereby expressly disclaimed. No representation or warranty is made, express or implied, that the content of this report is complete or accurate.
StoneX Financial Pte. Ltd. is not under any obligation to update this report.
Trading CFDs carries a high level of risk that may not be suitable for some investors. Consider your investment objectives, level of experience, financial resources, risk appetite and other relevant circumstances carefully. The possibility exists that you could lose some or all of your investments, including your initial deposits. If in doubt, please seek independent expert advice. Visit www.forex.com/en-sg/terms-and-policies for the complete Risk Disclosure Statement.