




USD/JPY, GBP/USD, gold forecast: Technical levels for May 8, 2024
GBP/USD could extend its losses despite the US dollar 'rebound' already losing steam, whilst gold's base looks set for a bullish breakout and USD/JPY might achieve another leg higher before it tops. In my opinion, at least.
Share this:

USD/JPY technical analysis:
The 1-hour chart of USD/JPY shows a clear uptrend. And were it any major currency pair, I’d be happy with that, but we clearly have to factor in the BOJ and the potential for another intervention. Interestingly, the first two interventions saw USD/JPY retrace higher before topping out around the 61.8% level of the intervention range itself. This time around it has surpassed the 51.8% and edging towards the 78.6% level, near a high-volume node. Furthermore, the market spied above the 155 handle during the Asian session, and as this has not sparked any bearish volatility then I suspect the 155.5 handle could be tested in the coming hours.
Yet RSI (14) is tracking prices higher to confirm the gently rally, although it is teetering on the edge of the overbought zone. Ultimately I suspect the upside has further to go, which could allow for bullish intraday trend traders to step in. Yet I am also keeping an eye out for a spike of bearish volatility below 156, as I suspect the current rise from the third intervention has had a good enough run to warrant a pullback in due course.
GBP/USD technical analysis
Out of all the FX majors, GBP/USD looks set to buckle against the USD irrespective of the dollar’s performance. Its strong rally from 1.23 formed a bearish pinbar around the 78.6% Fibonacci level, and subsequent bearish price action strongly suggests it was a noteworthy swing high.
Prices formed a bearish engulfing candle on Tuesday and continue beneath the monthly pivot during Asian trade on Wednesday. And it looks like it wants to fall to at least 1.24, just above the lower 1-week implied volatility band.
It seems traders are getting ahead of themselves for Thursday’s BOE meeting, where bets are on for indication of a June cut. But what if the BOE wobbles and doesn’t indicate such a move? The I’d expect some short covering and potentially a retest of the 200-day average. However, as most are in agreement that the BOE are on track to cut twice this year, having signalled ‘Fed independence’ regarding rates, an August cut followed by one in Q4 remains plausible. So even if prices do retrace higher, the bias remains bearish whilst prices remain beneath the May high.
Gold technical analysis:
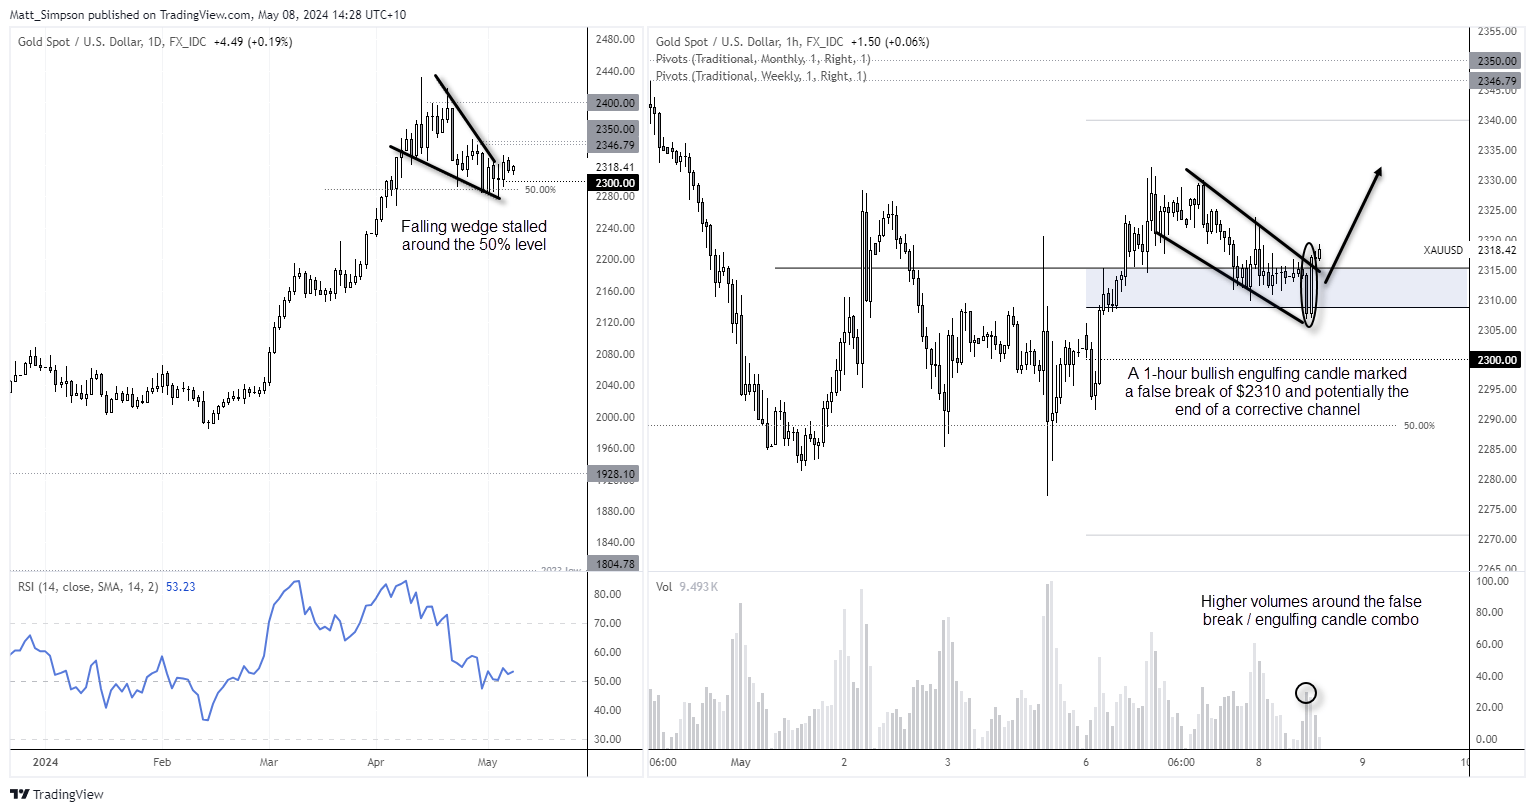
Last week I highlighted a bullish bias on gold, calling for the $2280 area to hold as support. Whilst we saw a minor breach of it following Friday’s NFP report, price action continues to suggest demand at those lows and potential leg higher.
A falling wedge has formed on the daily chart, which implies and upside target around $2400. I’ll reserve reservation for whether that will be reached, as we could also see gold deepen its correction before the anticipated break to new highs. But I think a move to at least the $2350 area seems feasible over the near term.
Gold has just formed a 1-hour bullish engulfing candle following a false break of $2310. Given high volumes formed on the false break and engulfing candle suggests the level was vigorously defended, and therefore demand may reside. Prices are now above the weekly and monthly pivot point, so today’s bias remains bullish above $2306 and for a move to $2030, a break above which brings $2350 into focus.
View the full economic calendar
View the full economic calendar
-- Written by Matt Simpson
Follow Matt on Twitter @cLeverEdge
How to trade with City Index
You can trade with City Index by following these four easy steps:
- Open an account, or log in if you’re already a customer
• Open an account in the UK
• Open an account in Australia
• Open an account in Singapore
- Search for the market you want to trade in our award-winning platform
- Choose your position and size, and your stop and limit levels
- Place the trade
Related tags:

Open an account in minutes
Experience award-winning platforms with fast and secure execution, and enjoy tight spreads from 0.5 pts on FX and 0.3 pts on indices.
Economic calendar
Web Trader platform
Our sophisticated web-based platform is packed with features.
Related articles

Tankan Backs BOJ Tightening, but Yen Rate Expectations Ease
Japan’s Tankan supports further BOJ tightening, although softer rate expectations could limit support for the Japanese yen.

Nikkei breakout accelerates as yen weakness returns
Nikkei has started October with a powerful breakout, helped by renewed yen weakness and strong upside momentum


AUD/USD hammered by US yields and fading RBA hike bets
US yields, dollar strength and fading RBA hike bets have combined to drive AUD/USD to fresh multi-month lows. The macro and technical bias remains bearish, although history suggests parts of the move are now reaching unusually stretched levels.
This report is intended for general circulation only. It should not be construed as a recommendation, or an offer (or solicitation of an offer) to buy or sell any financial products. The information provided does not take into account your specific investment objectives, financial situation or particular needs. Before you act on any recommendation that may be contained in this report, independent advice ought to be sought from a financial adviser regarding the suitability of the investment product, taking into account your specific investment objectives, financial situation or particular needs.
StoneX Financial Pte. Ltd., may distribute reports produced by its respective foreign entities or affiliates within the StoneX group of companies or third parties pursuant to an arrangement under Regulation 32C of the Financial Advisers Regulations. Where the report is distributed to a person in Singapore who is not an accredited investor, expert investor or an institutional investor (as defined in the Securities Futures Act), StoneX Financial Pte. Ltd. accepts legal responsibility to such persons for the contents of the report only to the extent required by law. Singapore recipients should contact StoneX Financial Pte. Ltd. at 6826 9988 for matters arising from, or in connection with the report.
In the case of all other recipients of this report, to the extent permitted by applicable laws and regulations neither StoneX Financial Pte. Ltd. nor its associated companies will be responsible or liable for any loss or damage incurred arising out of, or in connection with, any use of the information contained in this report and all such liability is hereby expressly disclaimed. No representation or warranty is made, express or implied, that the content of this report is complete or accurate.
StoneX Financial Pte. Ltd. is not under any obligation to update this report.
Trading CFDs carries a high level of risk that may not be suitable for some investors. Consider your investment objectives, level of experience, financial resources, risk appetite and other relevant circumstances carefully. The possibility exists that you could lose some or all of your investments, including your initial deposits. If in doubt, please seek independent expert advice. Visit www.forex.com/en-sg/terms-and-policies for the complete Risk Disclosure Statement.