



USD/JPY Update: Can the yen prevent a move toward new highs?
At the start of the week, USD/JPY is once again showing notable buying pressure. Over the last few trading sessions, the pair has posted an average gain of more than 0.7% in favor of the U.S. dollar, beginning to erase part of the recovery attempt seen in the yen during the previous week.
Share this:

At the start of the week, USD/JPY is once again showing notable buying pressure. Over the last few trading sessions, the pair has posted an average gain of more than 0.7% in favor of the U.S. dollar, beginning to erase part of the recovery attempt seen in the yen during the previous week.
For now, the bullish bias that has dominated the pair for several weeks appears to remain in place. U.S. dollar strength continues to be a key driver, while the market still does not seem fully convinced that the Bank of Japan could adopt a much more aggressive stance in the short term. If this dynamic holds, upward pressure on USD/JPY could remain relevant over the next few trading sessions.


Is the dollar still applying pressure?
Several sessions have passed since the release of the U.S. NFP employment report. Although a weaker-than-expected figure initially triggered a correction in the dollar, that reaction now appears to have faded. In recent sessions, the U.S. dollar has regained strength consistently, supported largely by the behavior of the U.S. bond market.
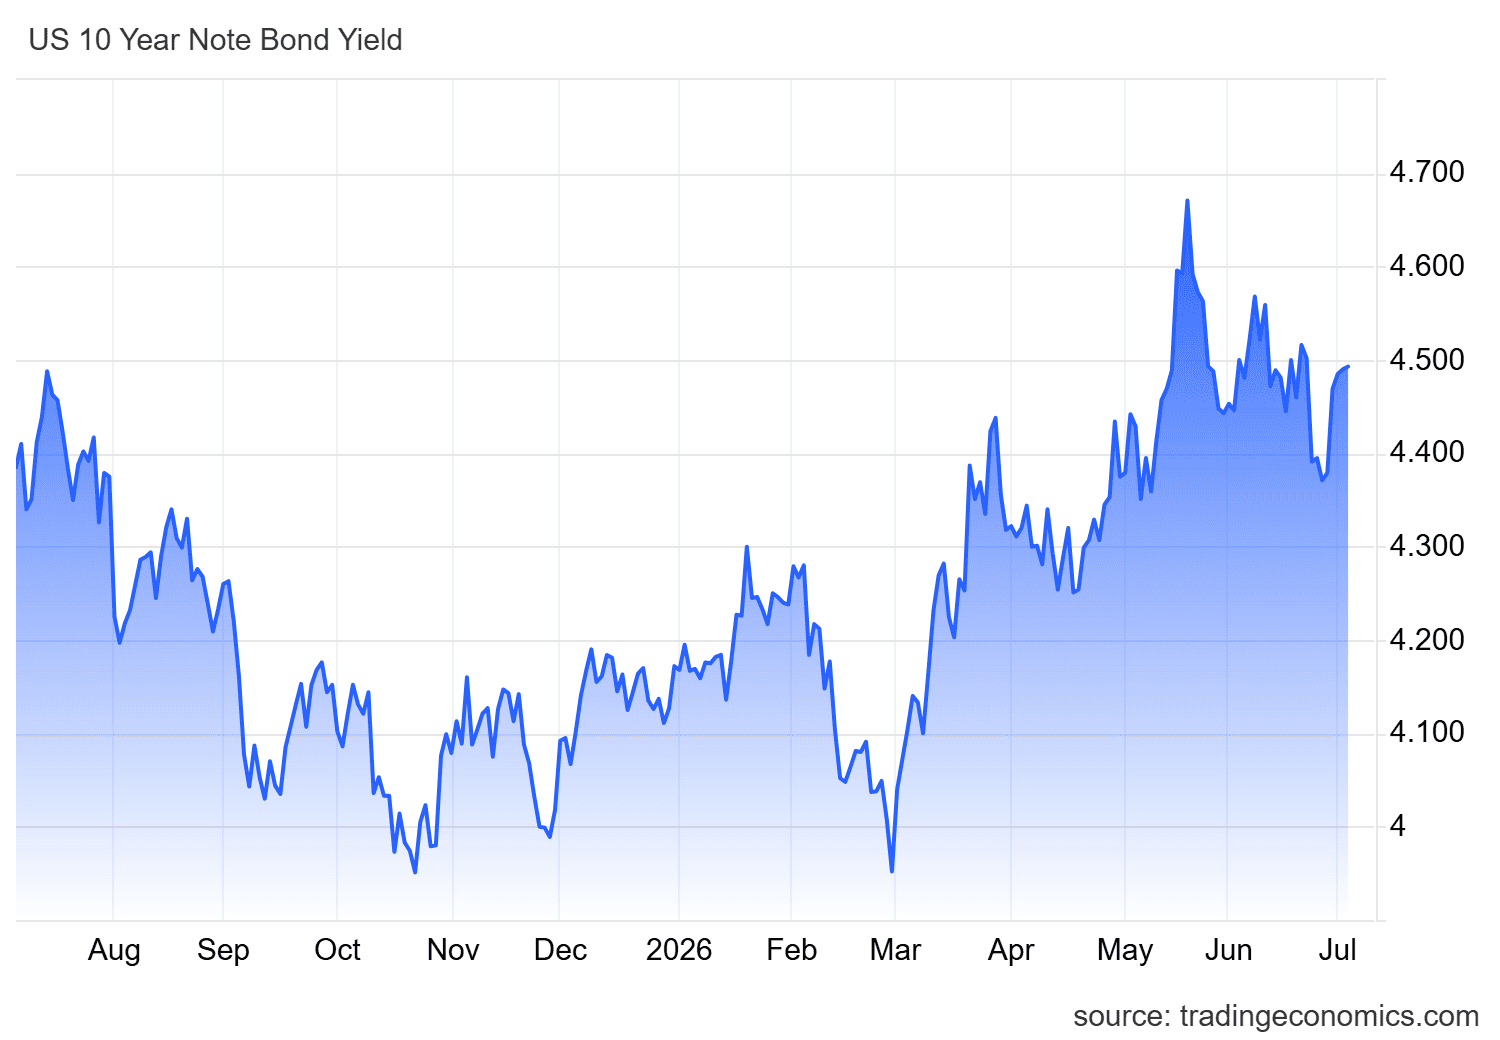
During the latest trading sessions, U.S. Treasury yields have staged an important recovery, with the benchmark rate moving back toward the 4.5% area. This keeps the U.S. fixed-income market among the most attractive and stable globally, even after the release of weaker employment data. Overall, this behavior suggests that the market is still not fully pricing in a much less aggressive shift from the Federal Reserve over the coming months.
Source: TradingEconomics
This dynamic is relevant for the U.S. dollar because, as bond yields remain elevated, dollar-denominated investments may continue to attract foreign capital. This supports demand for the dollar and could help sustain its strength in the short term.
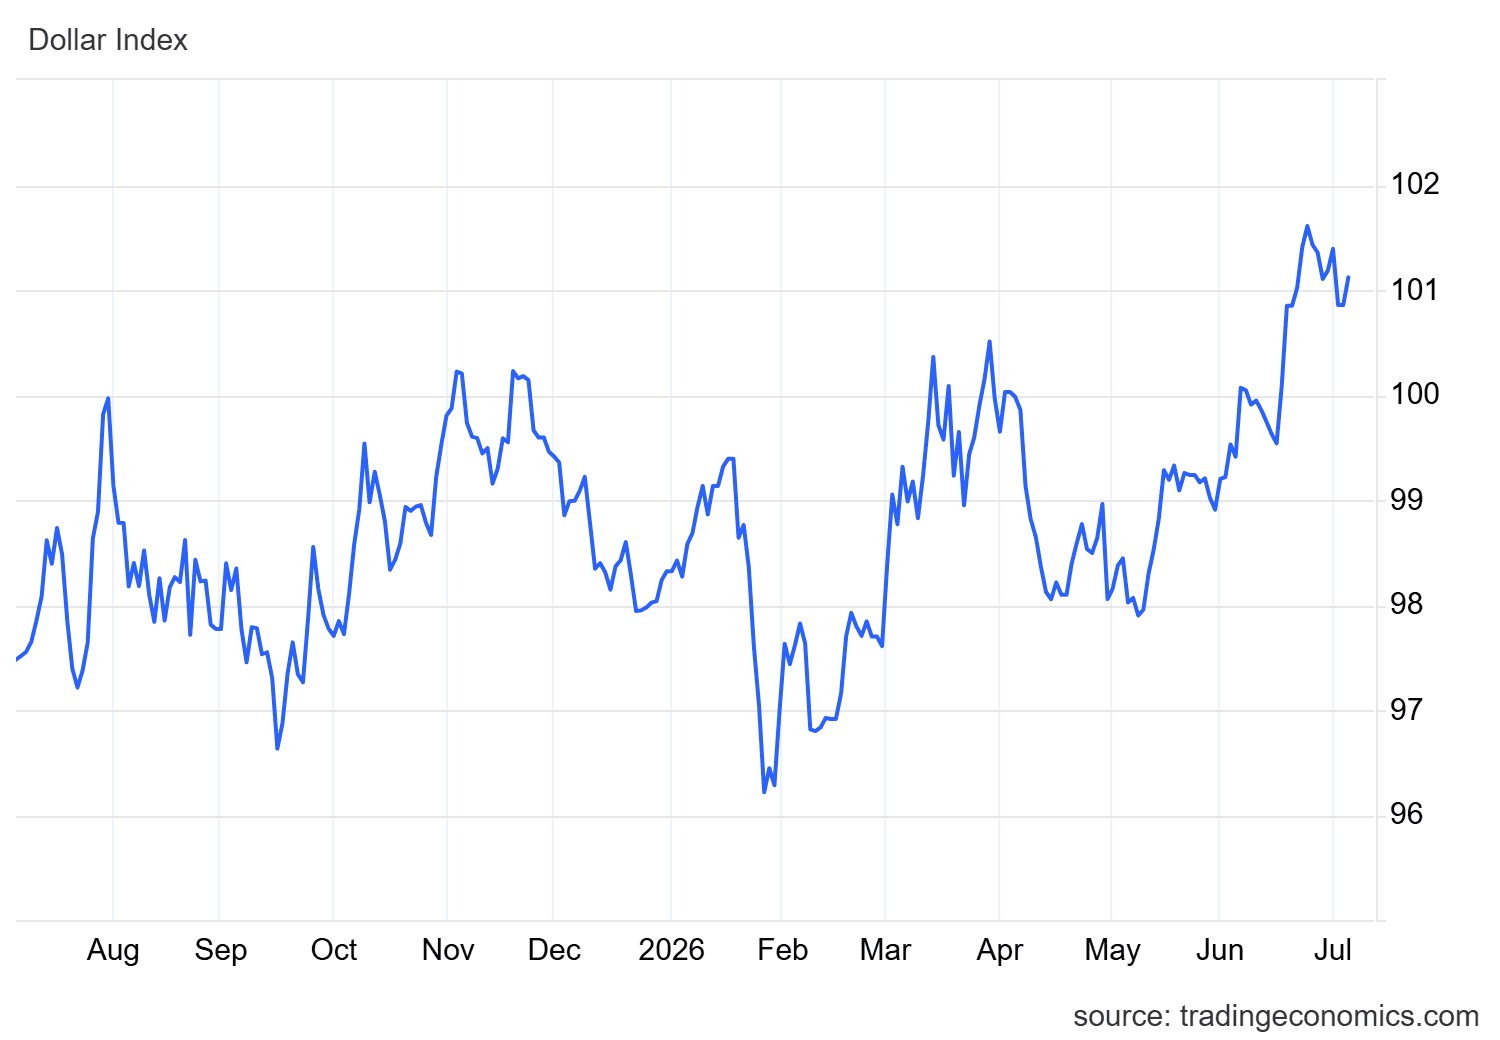
This behavior is already reflected in the DXY index, which measures the dollar’s strength against its main peers. Now, the index continues to recover above the 101-point area, confirming that demand for dollars remains relatively stable. Part of this momentum may be linked to the appeal still offered by the U.S. bond market.
Source: TradingEconomics
The dynamic remains important for USD/JPY. If U.S. bonds continue to support dollar strength, the Japanese yen could struggle to recover ground on a sustained basis. Under this scenario, buying pressure on the pair could remain in place over the coming sessions.
Is the Bank of Japan failing to convince markets?
Another key factor for USD/JPY is the stance of the Bank of Japan. Although the central bank has raised its interest rate to the 1.00% area, this remains well below the U.S. benchmark rate, which is close to 3.75%. This difference keeps the rate differential favorable for the dollar, making dollar-denominated investments appear more attractive than yen-denominated alternatives.
For this outlook to change meaningfully, the rate differential would need to start narrowing. However, that would require a more aggressive Bank of Japan, something markets do not appear to be fully pricing in for now.
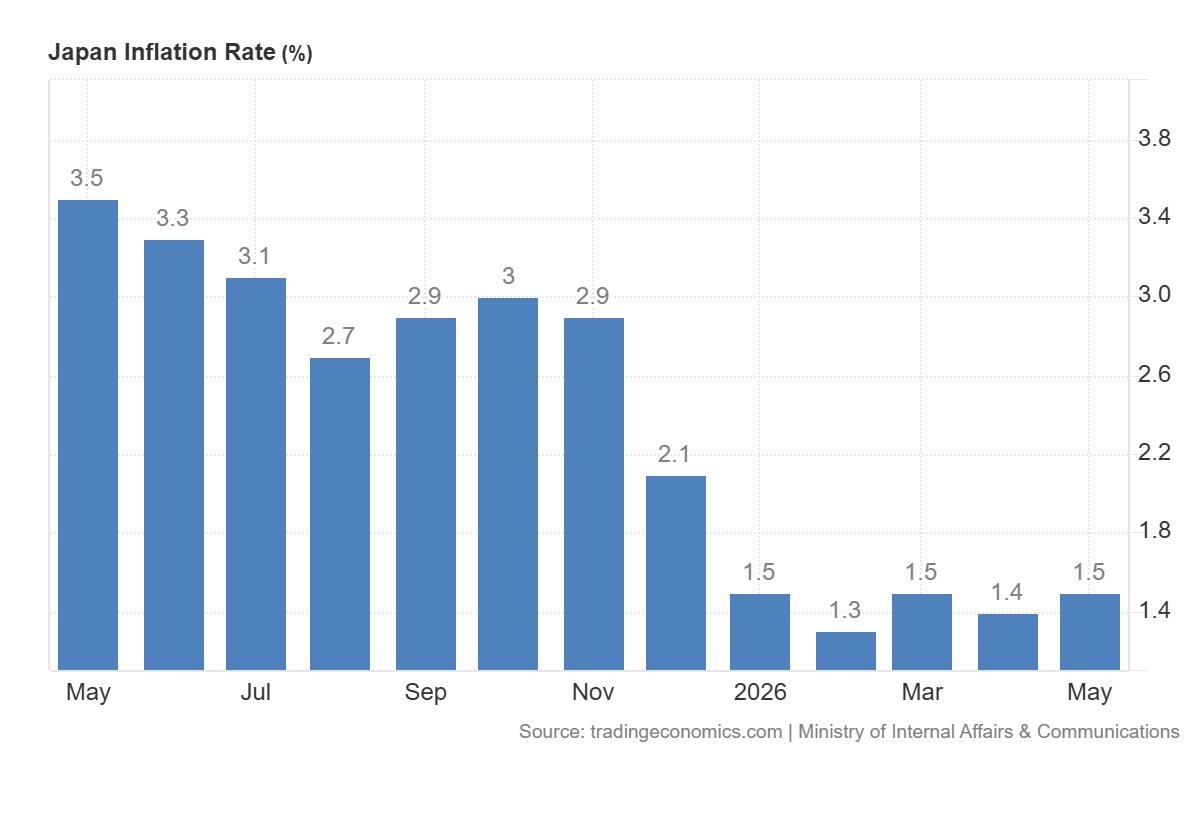
In this context, inflation in Japan has also failed to show a strong enough acceleration. As of May, the data remains around 1.5%, with no clear signs of more persistent inflationary pressure in the short term. In addition, recent figures remain below the central bank’s 2.00% target.
Source: TradingEconomics
Considering that the next Bank of Japan decision will come in late July, the recent inflation trend appears to align with the pause-oriented message delivered after the latest interest rate increase to 1.00%. Under this scenario, the central bank may not see the need for additional aggressive hikes in the short term.
This is relevant because, as long as expectations for a more restrictive Bank of Japan do not increase, the rate differential with the United States could continue to favor the dollar. As a result, yen-denominated investments may continue to look less attractive, which could keep significant buying pressure on USD/JPY, even over a medium-term horizon.
Technical outlook for USD/JPY
Source: StoneX, Tradingview
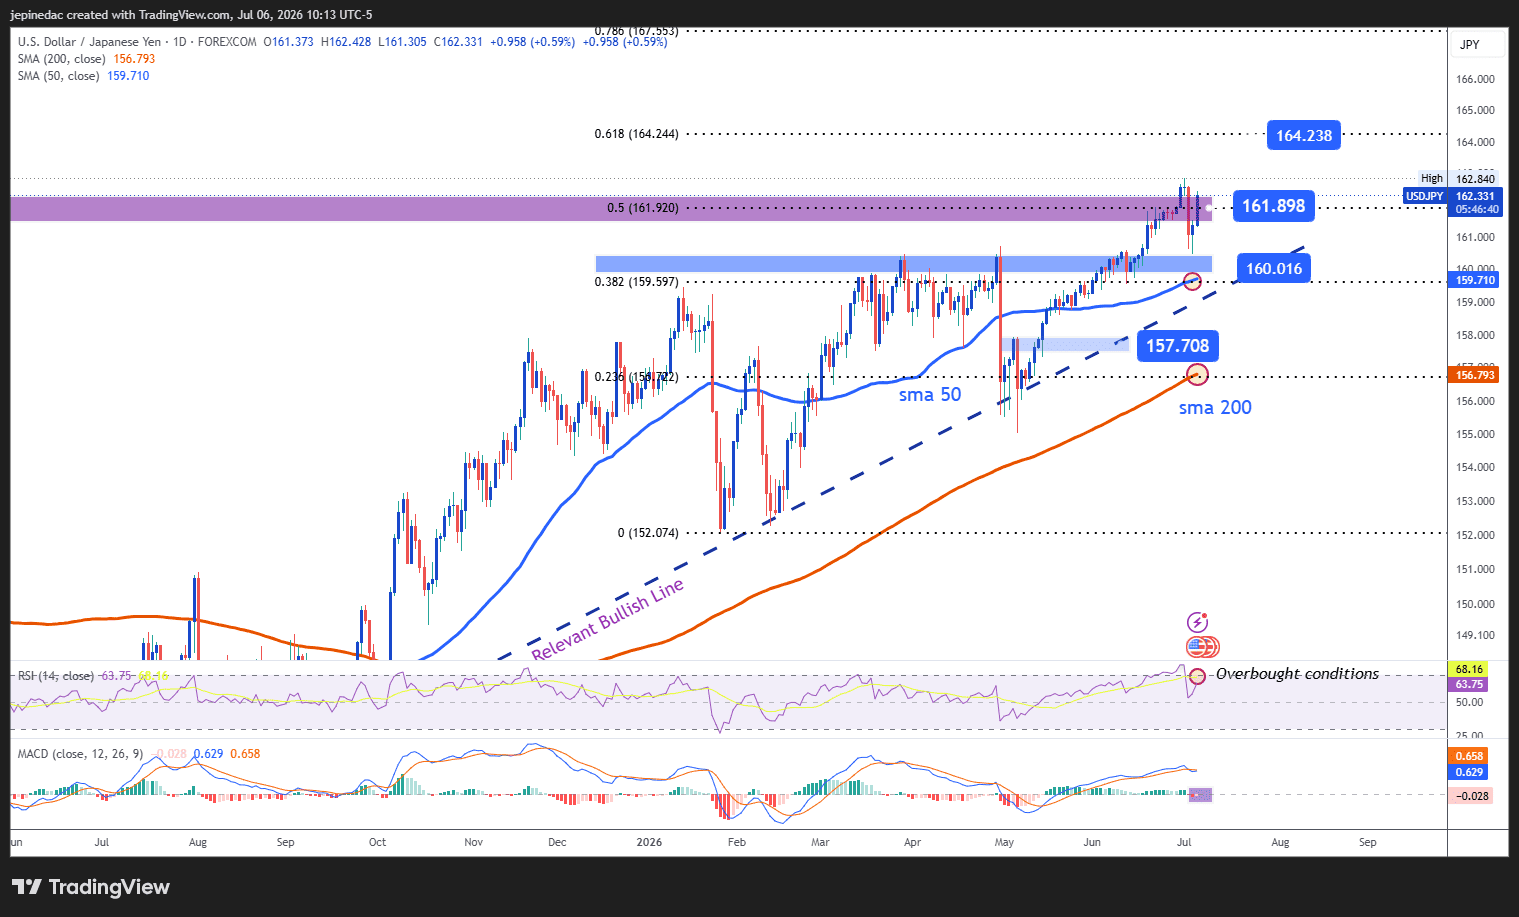
- Bullish trend appears unstoppable: For several months, USD/JPY has maintained a dominant bullish trend line. This structure remains the most relevant pattern on the chart, especially given the lack of sufficiently strong selling moves that could put the main trend at risk. If buying pressure manages to stabilize, this trend line could continue to act as the key technical reference for the next few trading sessions.
- RSI: The RSI indicator remains above the neutral 50 level, although it is still away from overbought territory. This suggests that bullish momentum remains dominant, but without yet showing an extreme exhaustion signal. If the indicator manages to hold in this area, it could continue to support the idea of an active buying bias in the short term. However, a move below the 50 level would begin to weaken this reading.
- MACD: The MACD indicator, meanwhile, shows a histogram that is moving increasingly close to the neutral 0 area. This suggests that the strength of short-term moving averages is starting to balance out. Although the main trend remains bullish, this signal also reflects some loss of momentum in the short term. For this reason, a phase of indecision cannot be ruled out before the market defines a new directional move.
Key levels:
- 164.238 – Key resistance: Given the lack of relevant references from previous years, this level coincides with the area marked by the 61.8% trend-based Fibonacci extension. For this reason, it remains one of the most important bullish barriers to watch in the short term. If price manages to approach this zone again, it could reinforce the buying bias and give continuity to the bullish trend line as the dominant pattern over the coming weeks.
- 161.898 – Near-term barrier: This area works as an important technical reference, as it coincides with the highs recorded in previous weeks. If prices fail to move clearly away from this level, a phase of indecision or consolidation could begin to develop over the next few trading sessions.
- 160.016 – Main support: This area remains the most relevant support on the chart. In addition to coinciding with a recent retracement zone, it is also close to the 50-period simple moving average. If price moves too close to this level, stronger selling pressure could begin to reactivate. A clear break below this zone would put the bullish trend line at risk and could open the door to deeper correction in USD/JPY.
Written by Julian Pineda, CFA, CMT – Market Analyst
Follow him on: @julianpineda25
Latest market news



Open an account in minutes
Experience award-winning platforms with fast and secure execution, and enjoy tight spreads from 0.5 pts on FX and 0.3 pts on indices.
Economic calendar
Web Trader platform
Our sophisticated web-based platform is packed with features.
Related articles
EUR/USD weekly outlook: Oil, inflation and NFP in focus
After coming under significant pressure in recent weeks, the EUR/USD came off its lows to finish the week on a positive note on Friday, albeit with only a mild rebound. That was not enough to prevent the exchange rate falling for the third consecutive week, as the US dollar and bond yields rallied across the board.


EUR/USD Q4 2026 Outlook: Euro at a Crossroads as Fed, ECB Tighten 9 25 2026
EUR/USD enters Q4 at a pivotal inflection point as competing Fed-ECB policy paths and persistent inflation risks collide with major technical support.

S&P 500 Forecast: SPX rises as oil prices fall, but treasuries remain at multi-decade highs
U.S. stocks are rising on Friday after a volatile week that saw a surge in Treasury yields ripple through financial markets.

This report is intended for general circulation only. It should not be construed as a recommendation, or an offer (or solicitation of an offer) to buy or sell any financial products. The information provided does not take into account your specific investment objectives, financial situation or particular needs. Before you act on any recommendation that may be contained in this report, independent advice ought to be sought from a financial adviser regarding the suitability of the investment product, taking into account your specific investment objectives, financial situation or particular needs.
StoneX Financial Pte. Ltd., may distribute reports produced by its respective foreign entities or affiliates within the StoneX group of companies or third parties pursuant to an arrangement under Regulation 32C of the Financial Advisers Regulations. Where the report is distributed to a person in Singapore who is not an accredited investor, expert investor or an institutional investor (as defined in the Securities Futures Act), StoneX Financial Pte. Ltd. accepts legal responsibility to such persons for the contents of the report only to the extent required by law. Singapore recipients should contact StoneX Financial Pte. Ltd. at 6826 9988 for matters arising from, or in connection with the report.
In the case of all other recipients of this report, to the extent permitted by applicable laws and regulations neither StoneX Financial Pte. Ltd. nor its associated companies will be responsible or liable for any loss or damage incurred arising out of, or in connection with, any use of the information contained in this report and all such liability is hereby expressly disclaimed. No representation or warranty is made, express or implied, that the content of this report is complete or accurate.
StoneX Financial Pte. Ltd. is not under any obligation to update this report.
Trading CFDs carries a high level of risk that may not be suitable for some investors. Consider your investment objectives, level of experience, financial resources, risk appetite and other relevant circumstances carefully. The possibility exists that you could lose some or all of your investments, including your initial deposits. If in doubt, please seek independent expert advice. Visit www.forex.com/en-sg/terms-and-policies for the complete Risk Disclosure Statement.