






WTI Crude Oil Outlook: Bearish Risks Build as Traders Trim Longs
Crude oil rallies off recent lows, but positioning data and technical resistance suggest upside may be capped. Could WTI be setting up for another leg lower?
Share this:

View related analysis:
- Japanese Yen and VIX Rise as Wall Street Slips on Weak Bond Auction
- Gold Rebounds, Crude Oil Tests Support as Markets Eye Fed, Trade Talks
- WTI Crude Oil Analysis: Bears Eye Another Assault on $60
View related analysis:
- Japanese Yen and VIX Rise as Wall Street Slips on Weak Bond Auction
- Gold Rebounds, Crude Oil Tests Support as Markets Eye Fed, Trade Talks
- WTI Crude Oil Analysis: Bears Eye Another Assault on $60
WTI Crude Oil Positioning (CL): Weekly COT Report Analysis
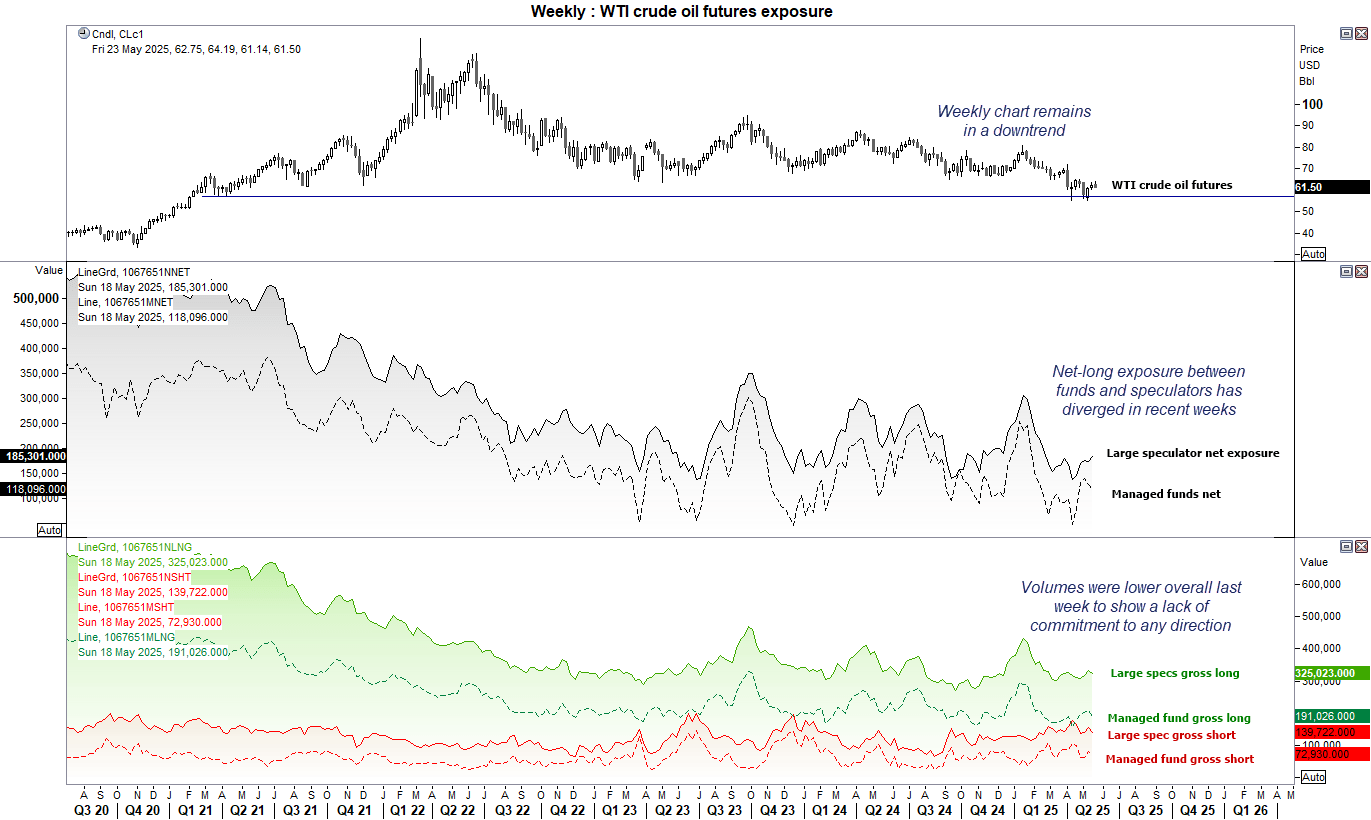
Managed funds and asset managers hold slightly opposing views on WTI crude oil futures. While both groups remain net-long, managed funds have trimmed their net-bullish positioning by approximately 20,000 contracts over the past two weeks, while large speculators have increased theirs by 10,000 contracts. Both sets of traders also reduced gross longs and shorts last week.
With no sentiment extreme to highlight and only marginal shifts in exposure, it hardly screams panic for WTI crude oil traders. However, the divergence in bullish positioning reflects a degree of uncertainty—and the lower volumes suggest a broader hesitancy to commit.
Still, the weekly charts remains in an apparent downtrend, which suggest another cycle low may not be out of the question. WTI crude oil may have already broken out of a bearish pattern on the monthly chart.
WTI Crude Oil Futures (CL) Technical Analysis
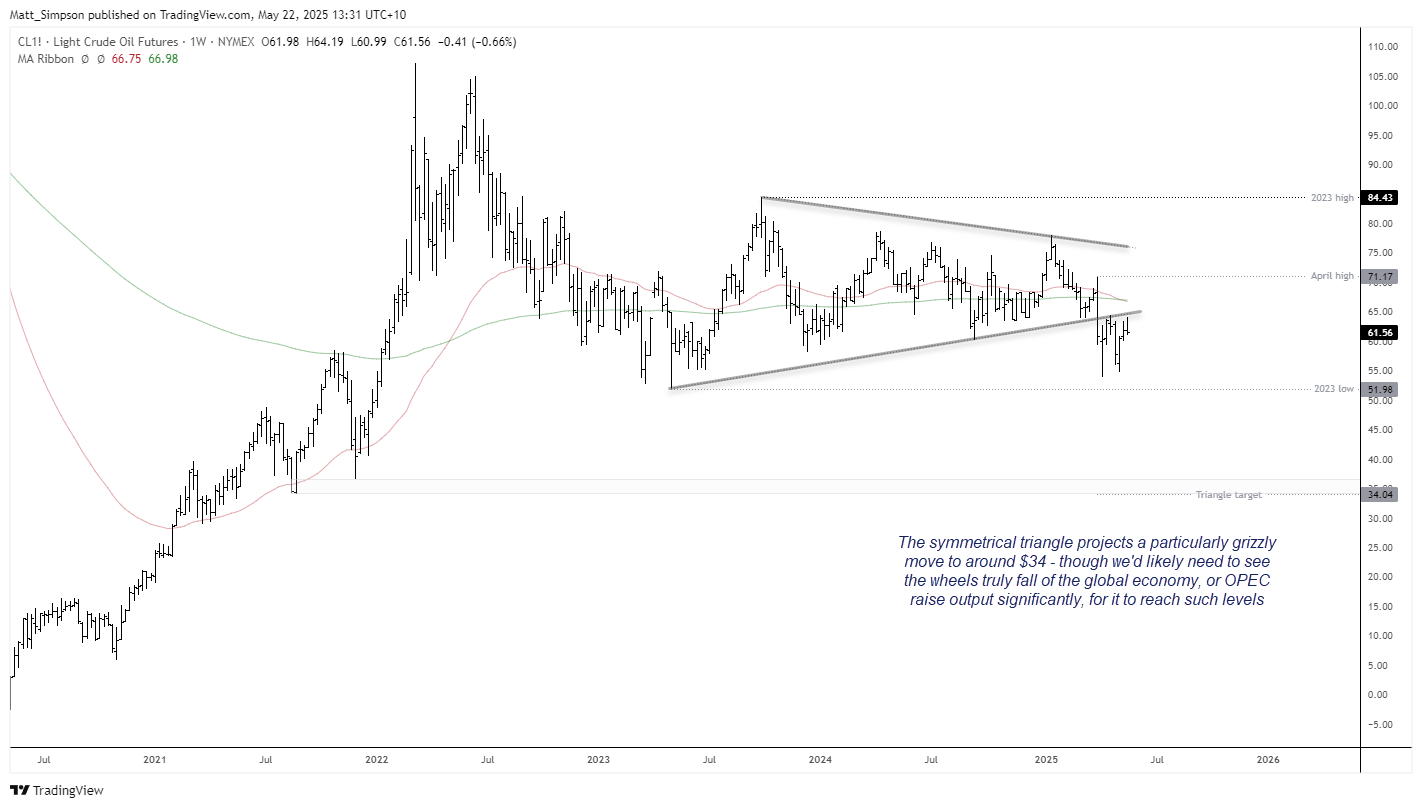
The weekly chart shows that a symmetrical triangle formed on WTI crude oil between May 2023 and March 2024. The near 2-Year pattern projects a downside target around $34. Whether it can reach such a grizzly level is questionable, unless the wheels really do fall of the global economy – or OPEC decide to significantly increase output.
Only time will tell, but a bearish setup may well be on the horizon, at least over the near term.
WTI Crude Oil Futures (Daily Chart)
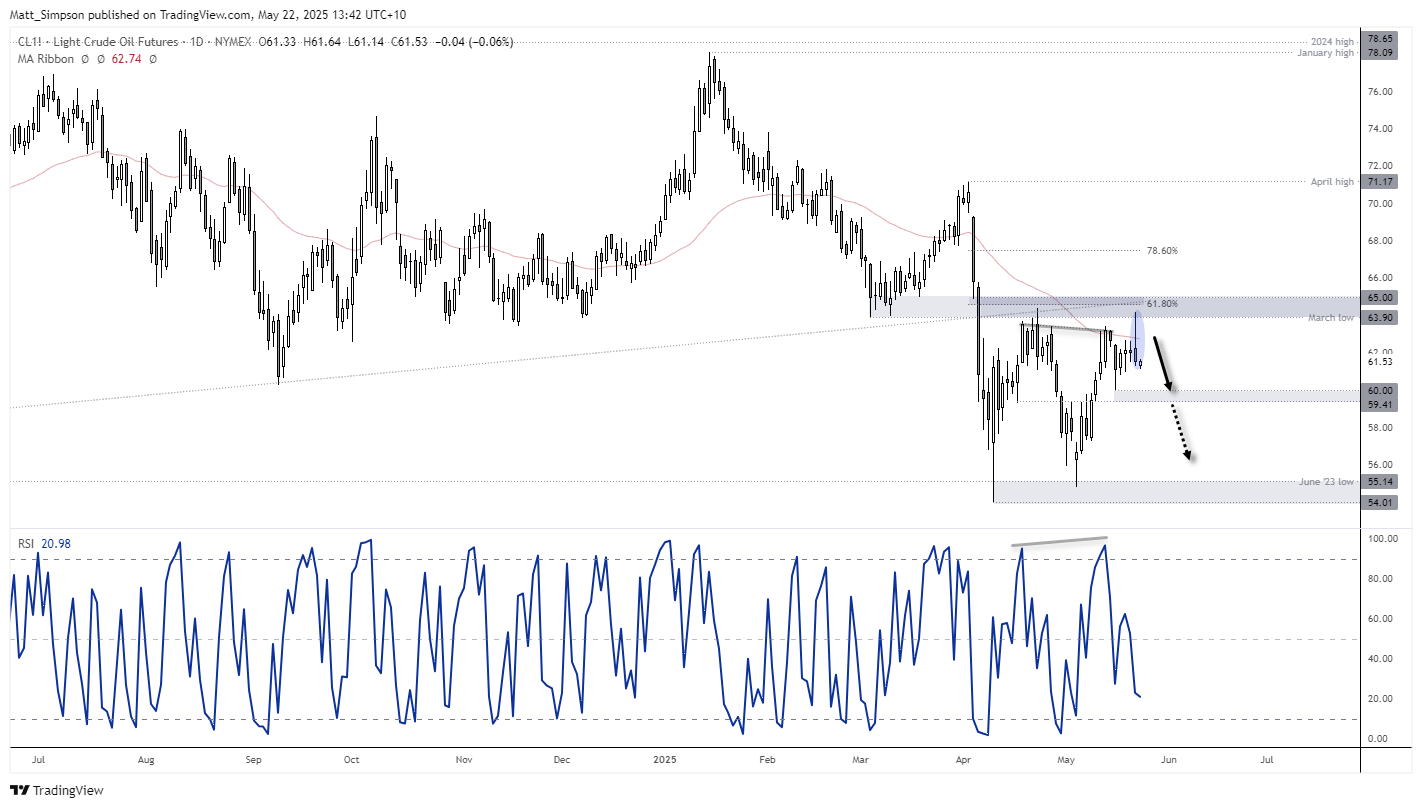
The daily chart shows that WTI crude oil has rallied 17% from the false break of the 2023 low to Wednesday’s high. However, an elongated inverted hammer has formed, and several resistance levels are clustered in the area. Notably, WTI closed below the 50-day EMA (exponential moving average) after failing to hold an intraday break above it, while yesterday’s high also stalled around the March low. Additional resistance comes from the $50 level, the 61.8% Fibonacci retracement, and a descending triangle trendline—all converging in this zone.
- Bears could look to fade into minor rallies towards the 50-day EMA at 60.74 or even the March high at 63.90.
- The 59.40–60.00 support zone could serve as an initial downside target; a break beneath this area brings 58.00 and the daily opens around 57.20 into focus.
- The bias remains bearish on the daily chart while prices trade beneath the double top near 64.30.
- A break below 54.00 would suggest the next major leg lower is underway, keeping the higher-timeframe channel target of $34.00 in play.
-- Written by Matt Simpson
Follow Matt on Twitter @cLeverEdge
How to trade with City Index
You can trade with City Index by following these four easy steps:
- Open an account, or log in if you’re already a customer
• Open an account in the UK
• Open an account in Australia
• Open an account in Singapore
- Search for the market you want to trade in our award-winning platform
- Choose your position and size, and your stop and limit levels
- Place the trade
Related tags:




Open an account in minutes
Experience award-winning platforms with fast and secure execution, and enjoy tight spreads from 0.5 pts on FX and 0.3 pts on indices.
Economic calendar
Web Trader platform
Our sophisticated web-based platform is packed with features.
Related articles

Crude Oil Forecast: Weekend Iran Strike Fears Lift Oil Toward War Highs
Brent crude oil is accelerating above $110 as traders price in the risk of a US-Israeli strike on Iran over the weekend. How much more of a geopolitical premium can oil build in before the close?


Nasdaq 100 Forecast: NDX Falls as the tech rout continues and oil prices soar
U.S. stocks are pointing to a modestly lower open after a sharp AI sell-off yesterday, as telecom stocks slide. Brent rises towards $115 adding to inflation pressures ahead of the FOMC rate decision.


Brent WTI Spread Hits 11-Year Wall and RSI Hits 2011 Highs
The Brent WTI spread is testing resistance that has held for about 11 years, with monthly RSI at overbought levels last seen in 2011.

This report is intended for general circulation only. It should not be construed as a recommendation, or an offer (or solicitation of an offer) to buy or sell any financial products. The information provided does not take into account your specific investment objectives, financial situation or particular needs. Before you act on any recommendation that may be contained in this report, independent advice ought to be sought from a financial adviser regarding the suitability of the investment product, taking into account your specific investment objectives, financial situation or particular needs.
StoneX Financial Pte. Ltd., may distribute reports produced by its respective foreign entities or affiliates within the StoneX group of companies or third parties pursuant to an arrangement under Regulation 32C of the Financial Advisers Regulations. Where the report is distributed to a person in Singapore who is not an accredited investor, expert investor or an institutional investor (as defined in the Securities Futures Act), StoneX Financial Pte. Ltd. accepts legal responsibility to such persons for the contents of the report only to the extent required by law. Singapore recipients should contact StoneX Financial Pte. Ltd. at 6826 9988 for matters arising from, or in connection with the report.
In the case of all other recipients of this report, to the extent permitted by applicable laws and regulations neither StoneX Financial Pte. Ltd. nor its associated companies will be responsible or liable for any loss or damage incurred arising out of, or in connection with, any use of the information contained in this report and all such liability is hereby expressly disclaimed. No representation or warranty is made, express or implied, that the content of this report is complete or accurate.
StoneX Financial Pte. Ltd. is not under any obligation to update this report.
Trading CFDs carries a high level of risk that may not be suitable for some investors. Consider your investment objectives, level of experience, financial resources, risk appetite and other relevant circumstances carefully. The possibility exists that you could lose some or all of your investments, including your initial deposits. If in doubt, please seek independent expert advice. Visit www.forex.com/en-sg/terms-and-policies for the complete Risk Disclosure Statement.