




Chinese yuan, stocks and commodities slump
Just when you thought the c-word was no more a thing for the markets…
Share this:

Well, here we are, more than 2 years into the pandemic and Covid is still roiling financial markets. Concerns about demand have intensified after Beijing locked down parts of Chaoyang District as the virus spread there. This triggered panic as people had hoped that lockdowns would ease in Shanghai rather than more restrictions being imposed elsewhere. But now the prospects of the capital city being put into a full lockdown has unnerved investors worldwide. Not only does this imply weaker demand from China, but it could reignite supply chain woes, further exacerbating inflationary pressures.
The Chinese yuan has fallen for the fifth day in a row, this time by more than 1%, lifting the USD/CNH to its highest level since November 2020. The Aussie and other commodity dollars have followed suit. Chinese equities dropped more than 5% overnight, with European and US futures also feeling the pain. Crude oil, copper and other metals all fell on demand concerns.
So, while the rest of the world’s largest economy are tightening belts, it looks like China might have to loosen its policy in order to keep its economy ticking over at the target rate in the second quarter. A couple of months ago, China set an economic growth target for the year of around 5.5%. This was the lowest level in more than a quarter-century of economic planning. But in light of the recent lockdowns, it might struggle to even achieve that target.
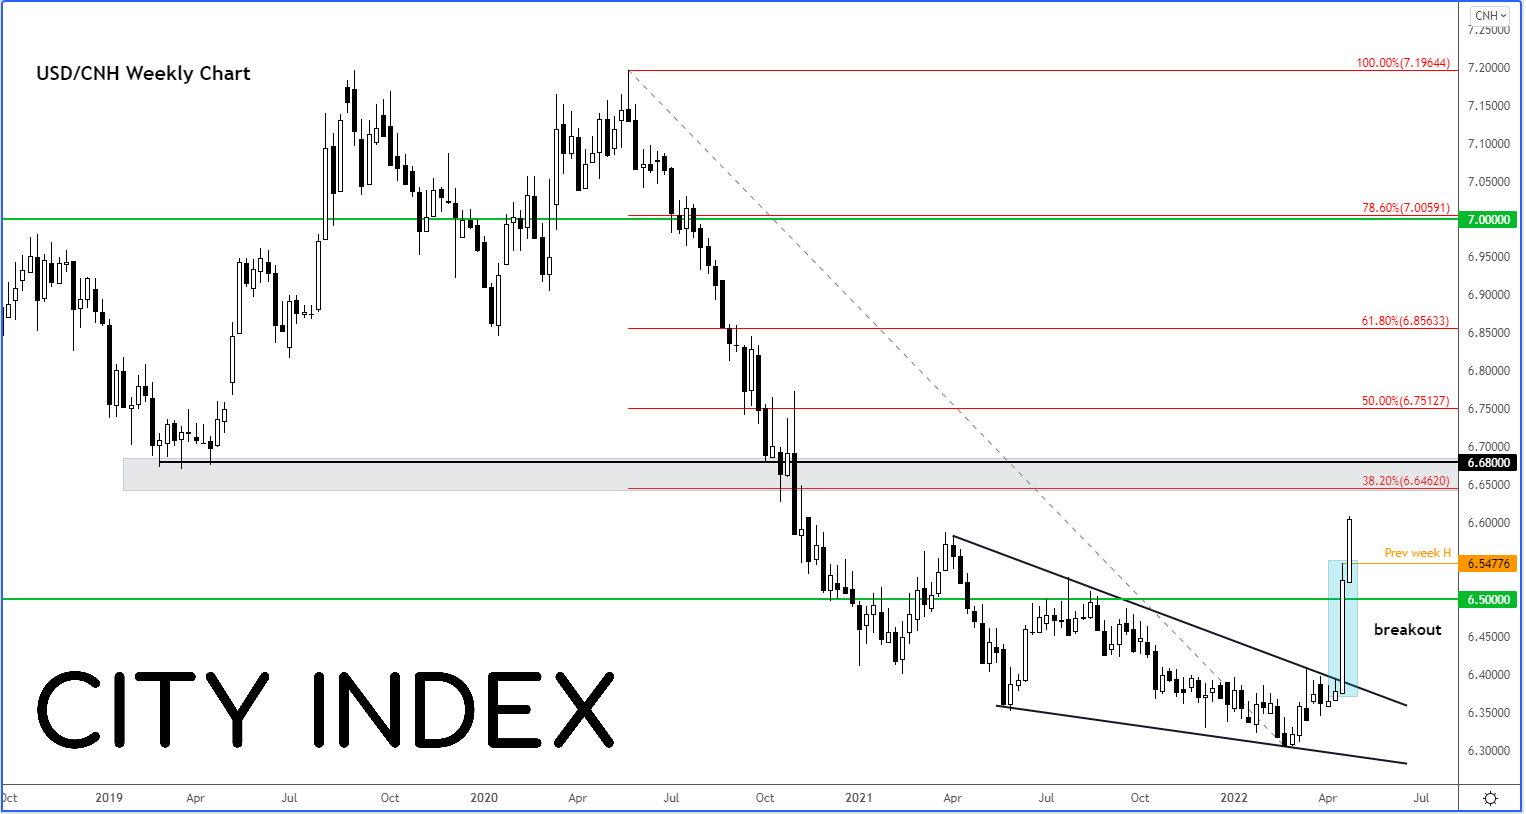
Indeed, fears over the Chinese economy saw the USD/CNH break out from a consolidation pattern last week, leading a big upsurge and follow-up technical buying in this pair (or selling in the yuan):
Source: StoneX and TradingView
For as long as the USD/CNH now remains above last week’s high at 6.5477, the short-term path of least resistance would be to the upside, meaning more weakness is likely for the yuan. From here, a move to the shaded region on the chart between 6.65 to 6.70 looks quite likely. Here, the 38.2% Fibonacci level meets prior support-turned-resistance area. I wouldn’t be surprised if this region were to offer only mild resistance, before the rally continues given expectations that monetary policy of the US will further diverge from that of China.
Well, here we are, more than 2 years into the pandemic and Covid is still roiling financial markets. Concerns about demand have intensified after Beijing locked down parts of Chaoyang District as the virus spread there. This triggered panic as people had hoped that lockdowns would ease in Shanghai rather than more restrictions being imposed elsewhere. But now the prospects of the capital city being put into a full lockdown has unnerved investors worldwide. Not only does this imply weaker demand from China, but it could reignite supply chain woes, further exacerbating inflationary pressures.
The Chinese yuan has fallen for the fifth day in a row, this time by more than 1%, lifting the USD/CNH to its highest level since November 2020. The Aussie and other commodity dollars have followed suit. Chinese equities dropped more than 5% overnight, with European and US futures also feeling the pain. Crude oil, copper and other metals all fell on demand concerns.
So, while the rest of the world’s largest economy are tightening belts, it looks like China might have to loosen its policy in order to keep its economy ticking over at the target rate in the second quarter. A couple of months ago, China set an economic growth target for the year of around 5.5%. This was the lowest level in more than a quarter-century of economic planning. But in light of the recent lockdowns, it might struggle to even achieve that target.
Indeed, fears over the Chinese economy saw the USD/CNH break out from a consolidation pattern last week, leading a big upsurge and follow-up technical buying in this pair (or selling in the yuan):
For as long as the USD/CNH now remains above last week’s high at 6.5477, the short-term path of least resistance would be to the upside, meaning more weakness is likely for the yuan. From here, a move to the shaded region on the chart between 6.65 to 6.70 looks quite likely. Here, the 38.2% Fibonacci level meets prior support-turned-resistance area. I wouldn’t be surprised if this region were to offer only mild resistance, before the rally continues given expectations that monetary policy of the US will further diverge from that of China.
How to trade with City Index
You can trade with City Index by following these four easy steps:
- Open an account, or log in if you’re already a customer
• Open an account in the UK
• Open an account in Australia
• Open an account in Singapore
- Search for the company you want to trade in our award-winning platform
- Choose your position and size, and your stop and limit levels
- Place the trade
Related tags:

Open an account in minutes
Experience award-winning platforms with fast and secure execution.
Economic calendar
Web Trader platform
Our sophisticated web-based platform is packed with features.
Related articles

NZD/USD Forecast: Kiwi faces historic breakdown as RBNZ survey looms
NZD/USD is teetering above support that held through the pandemic and Liberation Day turmoil. With RBNZ hawks repeatedly disappointed, today's inflation expectations survey could open the door to a slide towards the GFC lows.

USD/JPY, AUD/JPY: Central Bank Divergence Creates Two-Way Risk
USD/JPY eyes a breakout above 160, while AUD/JPY faces further losses as Fed, RBA and BoJ interest rate expectations diverge.


DXY, GBP/USD, AUD/USD, USD/CAD, USD/JPY, Gold Weekly Technical Outlook 11 16 2026
Sr. Technical Strategist Michael Boutros highlights the levels that matter on the USD Majors, commodities, and equity indices charts this week.

StoneX Financial Ltd (trading as "FOREX.com") is an execution-only service provider. This material, whether or not it states any opinions, is for general information purposes only and it does not take into account your personal circumstances or objectives. This material has been prepared using the thoughts and opinions of the author and these may change. However, FOREX.com does not plan to provide further updates to any material once published and it is not under any obligation to keep this material up to date.
This material is short term in nature and may only relate to facts and circumstances existing at a specific time or day. Nothing in this material is (or should be considered to be) financial, investment, legal, tax or other advice and no reliance should be placed on it. No opinion given in this material constitutes a recommendation by FOREX.com or the author that any particular investment, security, transaction or investment strategy is suitable for any specific person.
The material has not been prepared in accordance with legal requirements designed to promote the independence of investment research. Although FOREX.com is not specifically prevented from dealing before providing this material, FOREX.com does not seek to take advantage of the material prior to its dissemination. This material is not intended for distribution to, or use by, any person in any country or jurisdiction where such distribution or use would be contrary to local law or regulation. For further details see our full non-independent research disclaimer and quarterly summary.