



WTI Looks Firm As We Enter A Typically Strong Month
WTI stands near a 5-month high and, whilst there are near-term signs of exhaustion, market positioning, technicals and seasonality suggest further gains could eventually unfold.
Share this:

WTI stands near a 5-month high and, whilst there are near-term signs of exhaustion, market positioning, technicals and seasonality suggest further gains could eventually unfold.
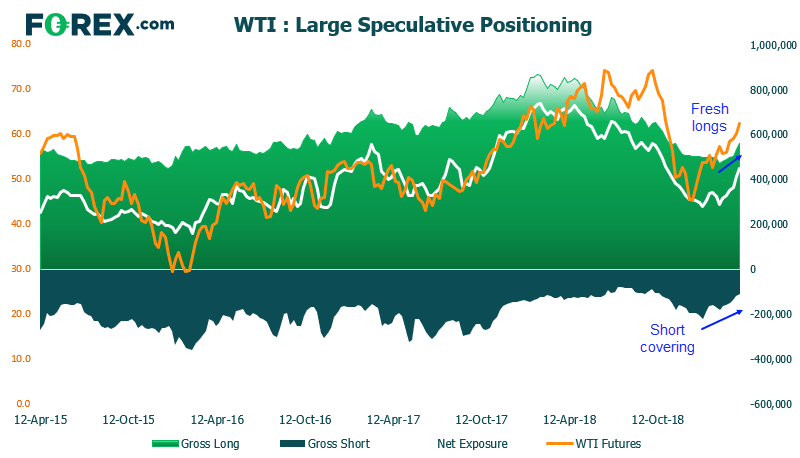
Ultimately, large speculators are loading up on longs and reducing short exposure, heading into what is typically WTI’s best month of the year. That said, my colleague Fawad outlined there could be fundamental reasons for limited upside and this is certainly something to consider if price action turns suddenly against the tide. But, for now, we’ll look at some supporting features of this otherwise unblemished bullish trend.
Net-long exposure for WTI has hit a 5-month high. Short-covering began around the middle of January, and steadily decreased to place gross shorts at their lowest level since October. Furthermore, long positions began to pick up at the end of February and are also at their highest level since October. Overall, this is exactly what we want to see with a healthy trend as it progresses.
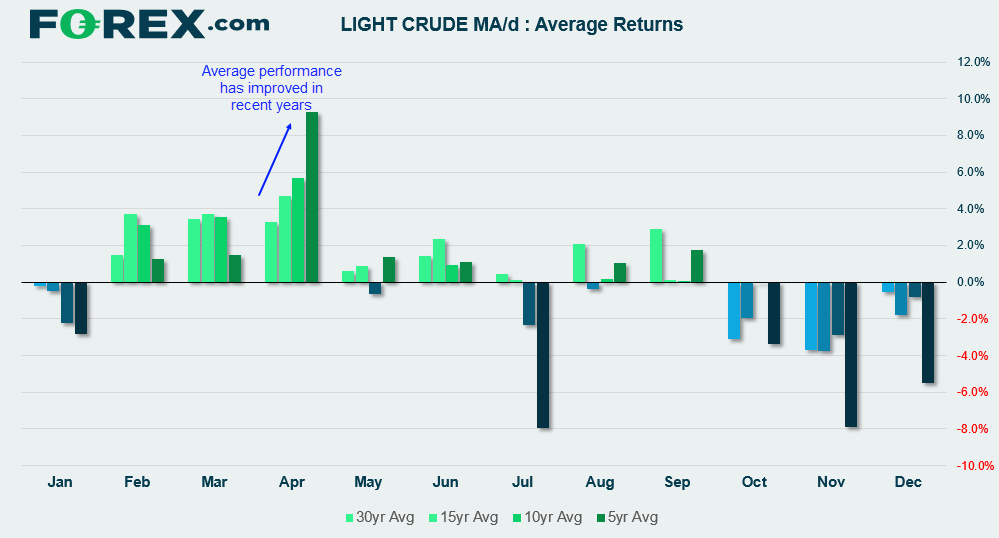
Seasonality could also favour WTI in April. April as typically seen stronger returns throughout April. Of course, whilst average returns or seasonal tendencies do not predict the future, they do show a pattern which we hope to be repeated in future. Placed alongside favourable positioning from large speculators, we hope gain further confidence in the underlying technical patterns.
WTI performance in April (30-Year average)
- April tends to be WTI’s best month of the year
- Closed positive 67.3% of the time
- Averaged a positive return of 8.2%
- Averaged a negative return of -4.7%
- Average returns have increased in recent years (according to 30, 15, 10 and 5yr averages)
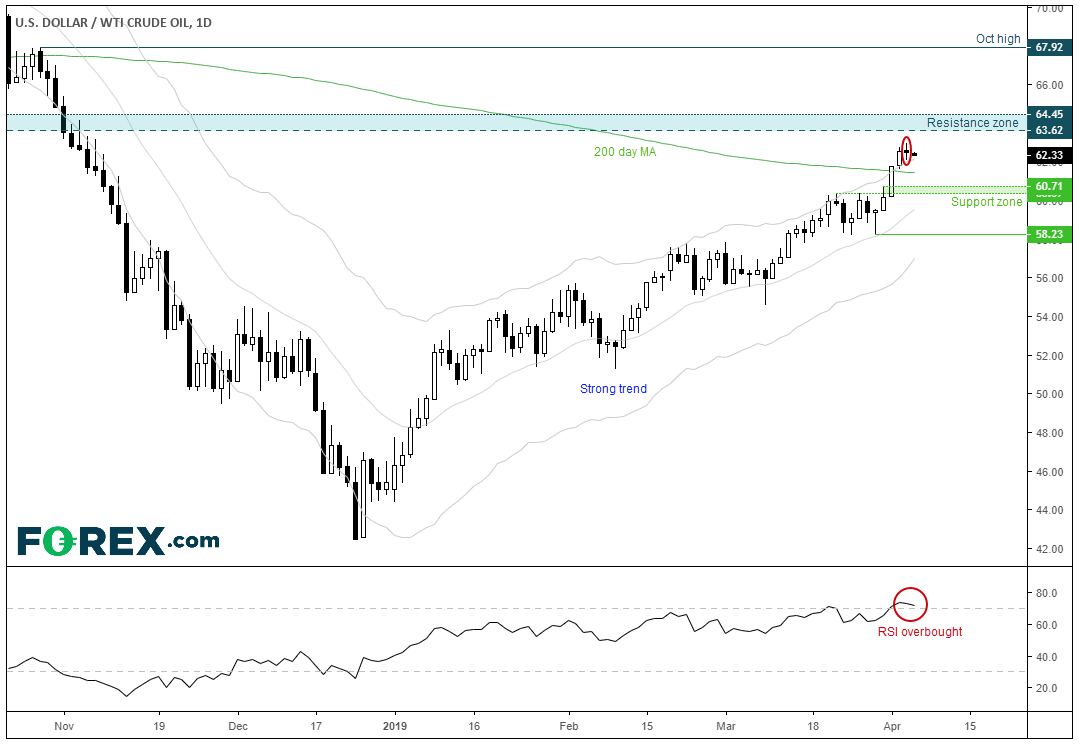
Technically, the trend remains strong although perhaps a little stretched over the near-term. The series of higher highs and lows, interconnected with shallow pull-backs underscores the strength of the trend structure. Prices have broken above the 200-day average on its first attempt (which is no mean feat) although there are signs of exhaustion around current levels. Yesterday’s spinning top reversal traded outside of the upper Keltner band and RSI is overbought. We don’t consider these as detrimental to the trend, but they do raise the odds of a pause, or retracement.
Look for support above the 60.37/71 zone. A retracement towards these levels improves the potential reward to risk ratio. We may even find the 200-day average provide support, although it isn’t uncommon to see prices oscillate around the 200-day average before the next significant move.
A break above 63.62-64.45 opens-up the October high at 67.92. However, we’d expect an initial price reaction around the June high/August lows, making them an interim target.The trend remains bullish above 58.23. However, if a deeper retracement occurs, the closer we come to retesting these levels the less appealing the trend structure becomes. Ideally, we want to see shallow pullbacks to show bulls remain dominant, and for it to spend a better chance of breaking above the near-by resistance zone. Therefore, a pullback towards 60.37/71 would be preferable before its next leg higher.
Related tags:


Open an account in minutes
Experience award-winning platforms with fast and secure execution.
Economic calendar
Web Trader platform
Our sophisticated web-based platform is packed with features.
Related articles
China's steel slump leaves iron ore bulls under the pump
Iron ore has broken major support, threatening a return to the lows of 2022 as mounting evidence of weakness in China's steel sector reinforces the bearish outlook.

NZD/USD Forecast: Kiwi faces historic breakdown as RBNZ survey looms
NZD/USD is teetering above support that held through the pandemic and Liberation Day turmoil. With RBNZ hawks repeatedly disappointed, today's inflation expectations survey could open the door to a slide towards the GFC lows.

DXY, GBP/USD, AUD/USD, USD/CAD, USD/JPY, Gold Weekly Technical Outlook 11 16 2026
Sr. Technical Strategist Michael Boutros highlights the levels that matter on the USD Majors, commodities, and equity indices charts this week.

StoneX Financial Ltd (trading as "FOREX.com") is an execution-only service provider. This material, whether or not it states any opinions, is for general information purposes only and it does not take into account your personal circumstances or objectives. This material has been prepared using the thoughts and opinions of the author and these may change. However, FOREX.com does not plan to provide further updates to any material once published and it is not under any obligation to keep this material up to date.
This material is short term in nature and may only relate to facts and circumstances existing at a specific time or day. Nothing in this material is (or should be considered to be) financial, investment, legal, tax or other advice and no reliance should be placed on it. No opinion given in this material constitutes a recommendation by FOREX.com or the author that any particular investment, security, transaction or investment strategy is suitable for any specific person.
The material has not been prepared in accordance with legal requirements designed to promote the independence of investment research. Although FOREX.com is not specifically prevented from dealing before providing this material, FOREX.com does not seek to take advantage of the material prior to its dissemination. This material is not intended for distribution to, or use by, any person in any country or jurisdiction where such distribution or use would be contrary to local law or regulation. For further details see our full non-independent research disclaimer and quarterly summary.