



ASX 200 Outlook: Record High Faces Options Expiry Test
The ASX 200 closed at another record high, but overbought conditions, key resistance and options expiry could limit further gains.
Share this:

The ASX 200 closed at a fresh record high on Wednesday, driven by strong gains in mining stocks as positive global sentiment continued to lift risk assets. However, with SPI futures stalling below the March record high, the Dow Jones printing a shooting star after five consecutive gains and options expiry due today, the rally could struggle to extend.
View related analysis:
View related analysis:
ASX 200 Outlook: Can Bulls Extend the Record Rally?
ASX 200 Market Snapshot
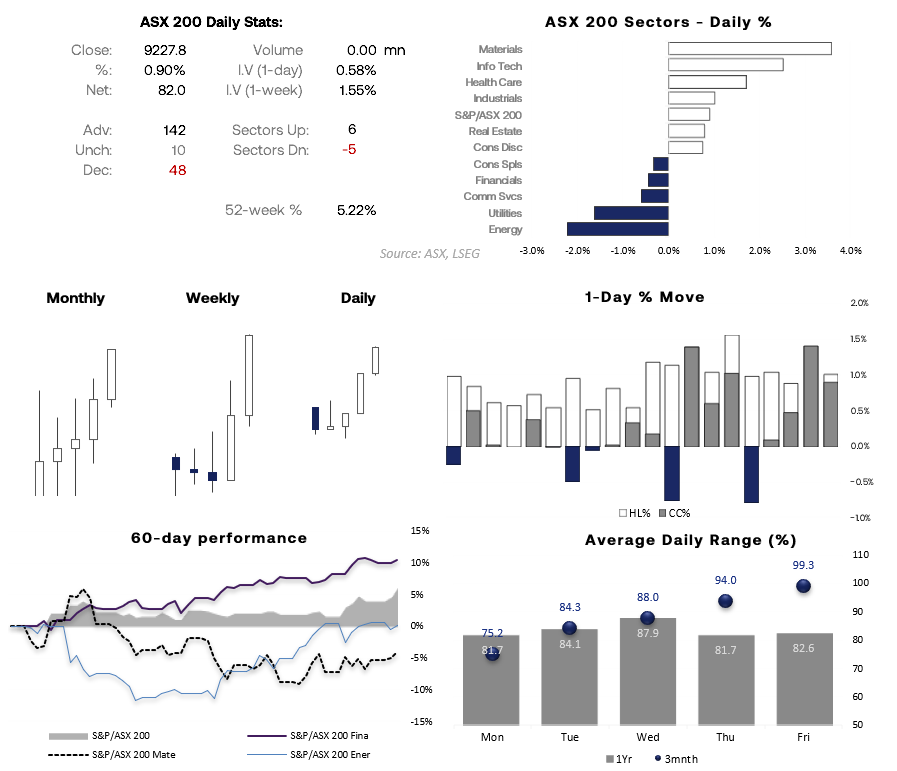
- Positive sentiment on the US-Iran deal saw the ASX 200 close at a record high on Wednesday, putting it on track for its best week in 17
- 6 of the 11 ASX sectors advanced, led by Materials (XMJ 3.6%), technology (XIJ 2.5%) and Health Care (XHJ 1.7%)
- Gains were concentrated in the materials sector, with BHP, Rio Tinto and gold miners accounting for much of the index's advance.
- Financials lagged despite the record close, suggesting investors favoured resource stocks over the major banks as earnings season approaches.
Source: ASX, LSEG
ASX 200 Correlations
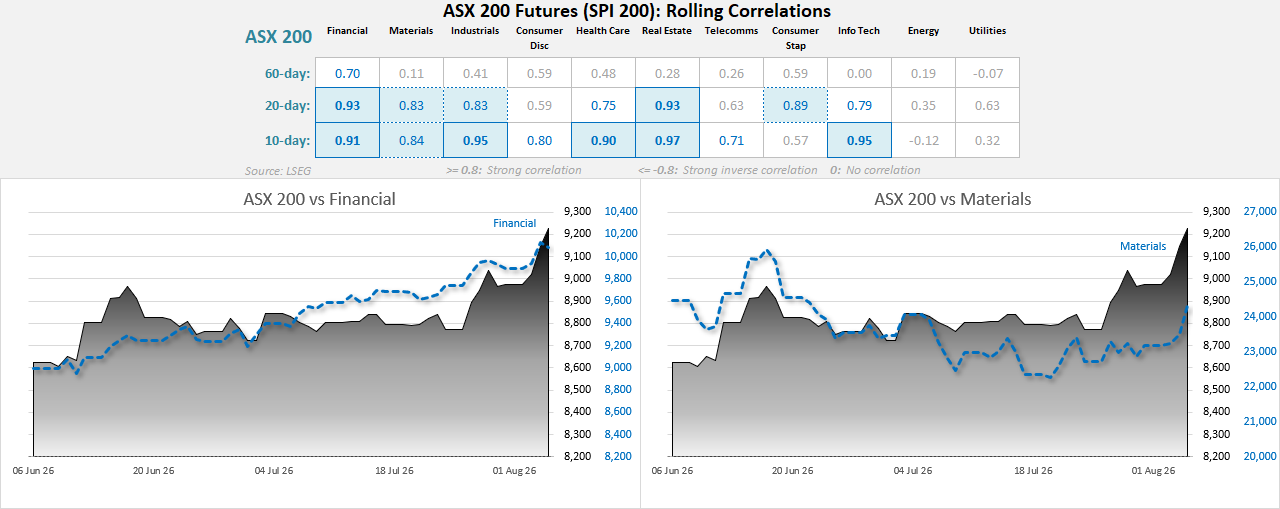
- Financials continue to show the strongest relationship with the ASX 200, so the major banks remain an important driver of the broader index.
- Materials have caught up quickly, with the 10-day correlation jumping to 0.95 as miners helped power the ASX 200 to fresh record highs.
- Correlations with Health Care, Real Estate and Information Technology have also strengthened over the past month, pointing to broader market participation.
- Energy remains the clear outlier, with little correlation to the ASX 200 over the past 10 days as sector-specific drivers continue to dominate.
Source: ASX, LSEG


ASX 200 Technical Analysis
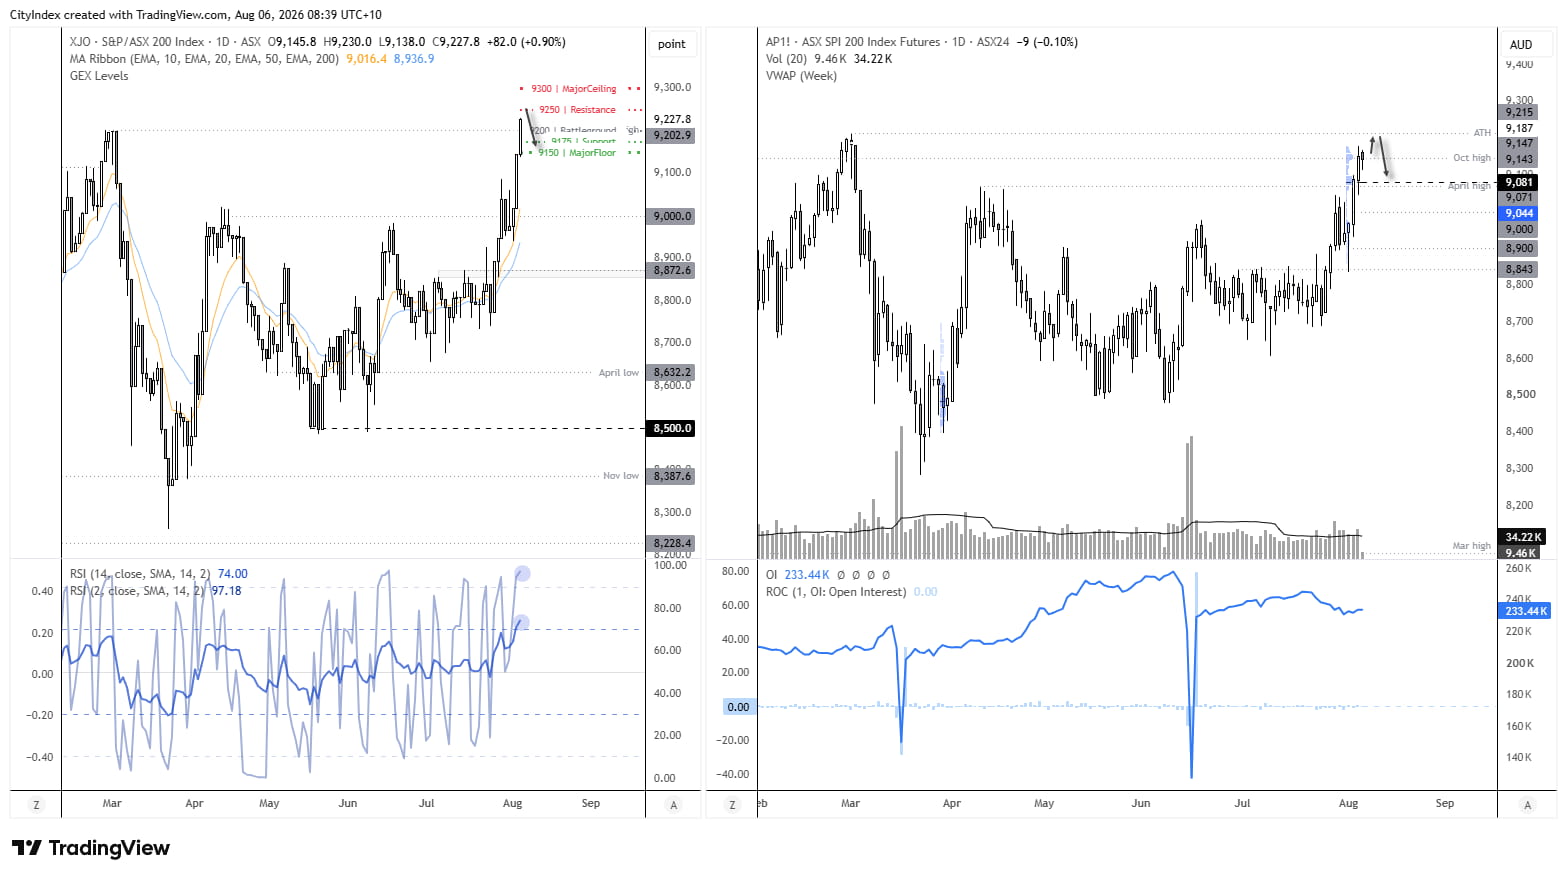
The ASX 200 heads into expiry day after closing at a record high, although SPI futures stalled just below the March record high overnight. With RSI in overbought territory, a shooting star on the Dow Jones after five consecutive gains, and today's options expiry, there are several reasons to expect some profit-taking. Therefore, my bias is that the ASX 200 may struggle to extend its gains today.
The broader trend remains bullish, but buyers may need to establish acceptance above key resistance before the rally can extend.
The 9200 strike is the key level to watch, with the largest concentration of options making it the most likely area to attract prices during today's session. Above there, 9250 is the first resistance level, while 9300 is a more significant upside hurdle if buyers can push beyond 9250. On the downside, 9175 is the first support level, followed by 9150 if selling pressure builds. A sustained break above 9250 could open the door to 9300, while failure to hold above it may see prices drift back towards 9200 into the close.
Source: ASX, TradingView
Options-Derived Support and Resistance
- 9300 – Major Ceiling: The largest nearby call concentration sits above today's expected range (690 calls vs 84 puts). A move towards 9300 becomes more likely if buyers can establish acceptance above 9250.
- 9250 – Ceiling: Strong call positioning (316 vs 70 puts) makes this the first key resistance level above current prices.
- 9200 – Magnet: The highest call open interest (852) is matched by meaningful put positioning (166), making this the strongest candidate to attract price on expiry.
- 9175 – Floor: Call open interest comfortably outweighs puts (503 vs 190), making this the first area where buying interest could emerge.
- 9150 – Major Floor: Another strong area of call dominance (502 vs 136), providing secondary support if 9175 fails.
Intraday Technical Analysis
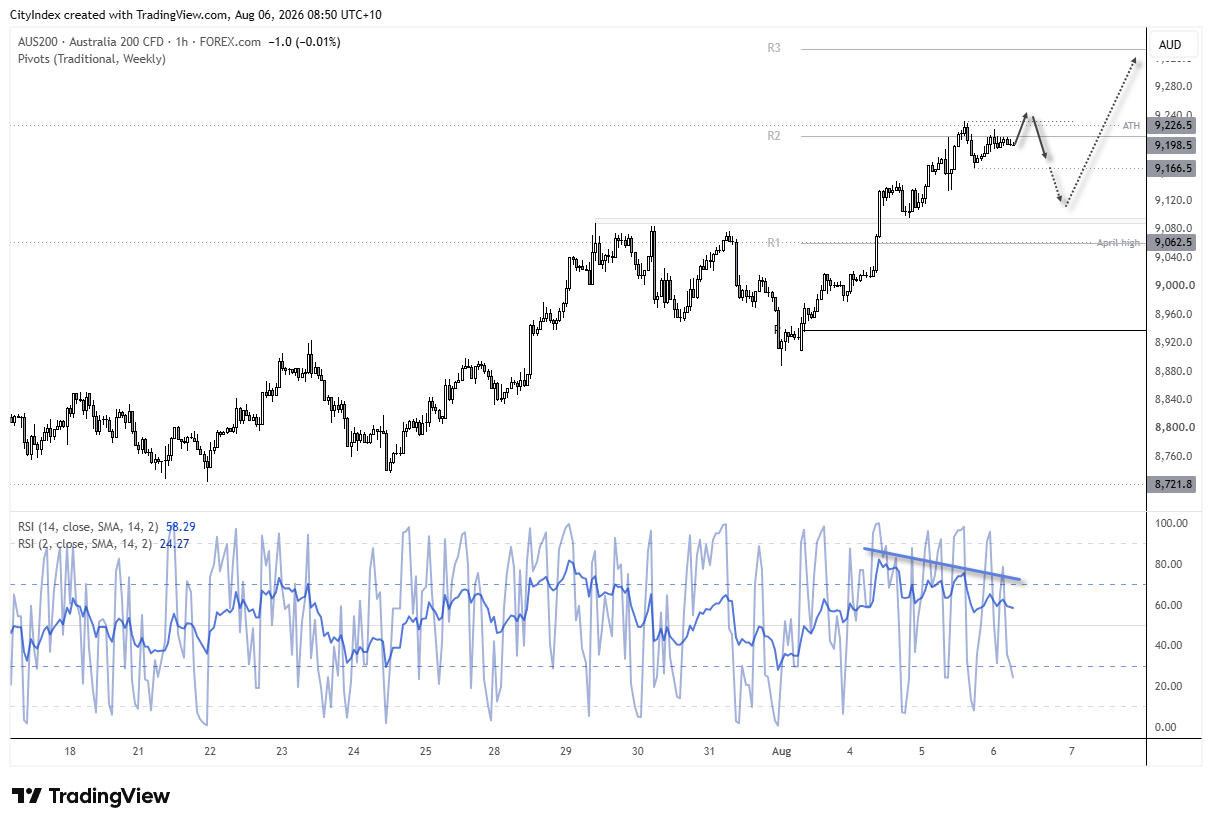
The 1-hour chart shows a potential lower high forming beneath the February record high. Prices are consolidating around the weekly R2 pivot, while a bearish divergence on the RSI suggests bullish momentum is beginning to fade.
Bears may want to see whether a break to fresh highs quickly reverses into a false breakout, or look for signs of weakness around yesterday's high. With options expiry likely to influence today's session, traders should be prepared for choppy and potentially erratic price action.
Source: Forex.com, TradingView
View the full economic calendar
View the full economic calendar
-- Written by Matt Simpson
Follow Matt on Twitter @cLeverEdge
How to trade with City Index
You can trade with City Index by following these four easy steps:
- Open an account, or log in if you’re already a customer
• Open an account in the UK
• Open an account in Australia
• Open an account in Singapore
- Search for the market you want to trade in our award-winning platform
- Choose your position and size, and your stop and limit levels
- Place the trade
Related tags:

Open an account in minutes
Experience award-winning platforms with fast and secure execution.
Economic calendar
Web Trader platform
Our sophisticated web-based platform is packed with features.
Related articles

NZD/USD Forecast: Kiwi faces historic breakdown as RBNZ survey looms
NZD/USD is teetering above support that held through the pandemic and Liberation Day turmoil. With RBNZ hawks repeatedly disappointed, today's inflation expectations survey could open the door to a slide towards the GFC lows.

USD/JPY, AUD/JPY: Central Bank Divergence Creates Two-Way Risk
USD/JPY eyes a breakout above 160, while AUD/JPY faces further losses as Fed, RBA and BoJ interest rate expectations diverge.

DXY, GBP/USD, AUD/USD, USD/CAD, USD/JPY, Gold Weekly Technical Outlook 11 16 2026
Sr. Technical Strategist Michael Boutros highlights the levels that matter on the USD Majors, commodities, and equity indices charts this week.

StoneX Financial Ltd (trading as "FOREX.com") is an execution-only service provider. This material, whether or not it states any opinions, is for general information purposes only and it does not take into account your personal circumstances or objectives. This material has been prepared using the thoughts and opinions of the author and these may change. However, FOREX.com does not plan to provide further updates to any material once published and it is not under any obligation to keep this material up to date.
This material is short term in nature and may only relate to facts and circumstances existing at a specific time or day. Nothing in this material is (or should be considered to be) financial, investment, legal, tax or other advice and no reliance should be placed on it. No opinion given in this material constitutes a recommendation by FOREX.com or the author that any particular investment, security, transaction or investment strategy is suitable for any specific person.
The material has not been prepared in accordance with legal requirements designed to promote the independence of investment research. Although FOREX.com is not specifically prevented from dealing before providing this material, FOREX.com does not seek to take advantage of the material prior to its dissemination. This material is not intended for distribution to, or use by, any person in any country or jurisdiction where such distribution or use would be contrary to local law or regulation. For further details see our full non-independent research disclaimer and quarterly summary.