



AUD/USD Nears 72c as AU and US CPI, Jackson Hole Loom
AUD/USD is closing in on 72c as Australian and US inflation reports collide with Jackson Hole, setting the stage for a potentially volatile end to the week.
Share this:

AUD/USD enters a potentially pivotal stretch within striking distance of 72c, with Australian CPI, US inflation and Jackson Hole putting RBA and Fed policy expectations firmly in focus.
View related analysis:
View related analysis:
Australian CPI, US Inflation and Jackson Hole Put AUD/USD in Focus
While markets are really waiting for the Fed Chair to speak at Jackson Hole on Friday, they have two key inflation reports to chew. Australia’s July CPI report lands at a particularly important time for the RBA, after minutes from its August meeting revealed that several board members considered another rate hike before ultimately voting to hold at 4.35%.
Australian CPI Tests the RBA’s Hawkish Bias
Inflation has cooled from its recent peak to 3.8% and trimmed mean inflation undershooting expectations, yet at 3.6% it remained well above the RBA’s 1-3% target band. Today’s release therefore provides another test of whether inflation is genuinely losing momentum or simply pausing. A softer headline number is widely expected due partly to base effects, which makes the trimmed mean and underlying details arguably more important for markets. A stronger-than-expected reading could revive expectations of another RBA hike and support the Australian dollar, while further evidence of cooling inflation could push tightening expectations further out.
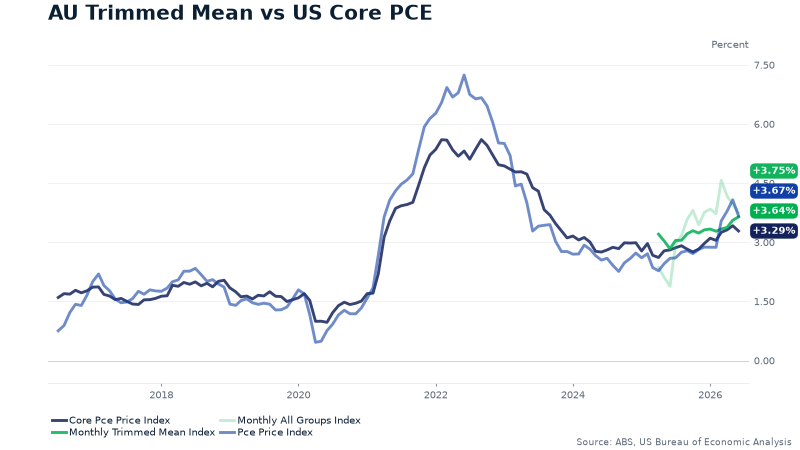
Source: ABS, BEA
US Core PCE Sets the Stage for Jackson Hole
US core PCE is equally important for Fed watchers, with the central bank maintaining a hawkish bias even though rates are expected to remain on hold at its next meeting. Today’s release could also shape Kevin Warsh’s messaging when he delivers his first Jackson Hole speech as Fed Chair on Friday, where markets will be looking for greater clarity on the Fed’s policy direction.
Core PCE is the Fed’s preferred inflation gauge and was running at 3.3% year on year in June, well above its 2% target. That leaves little room for another upside surprise after several Fed officials warned that persistent inflation could require further tightening. A hotter print would strengthen the case for another hike, potentially lifting US yields and the dollar, while a softer reading would ease some of those concerns and could reinforce the recent pressure on the greenback.
US Dollar Volatility Recedes Ahead of Jackson Hole and Inflation
The US dollar index was a touch lower on Tuesday to break its two-day retracement, forming a small shooting star reversal candle around the 99 handle. This pattern was mimicked by USD/CHF around its January high resistance, and USD/CAD, which met resistance around its 10-day EMA. Meanwhile, EUR/USD, GBP/USD and AUD/USD formed small bullish inside days beneath their cycle highs, though volatility was low overall.
This is a pattern I highlighted in Monday’s article, noting that volatility tended to recede heading into the Jackson Hole speech before erupting on the day. Perhaps that is why one-day implied volatility for AUD/USD is only moderately elevated at 127% of its 20-day average, despite incoming inflation reports of interest to both the RBA and Fed.
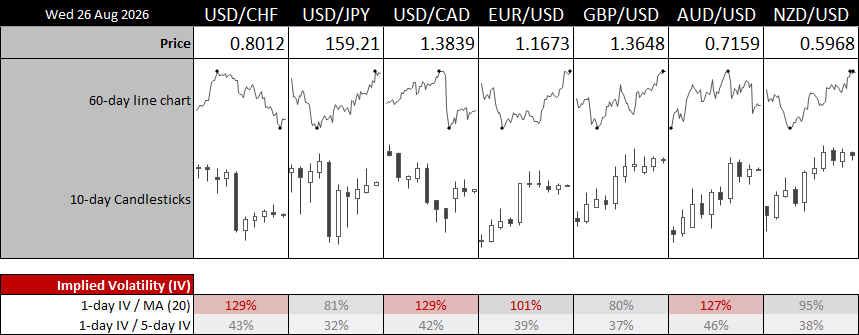
Source: LSEG
Jackson Hole Historically Delivers Volatility, Not Direction
Jackson Hole has historically been more reliable as a volatility event than a directional one. DXY volatility tends to ease in the days leading into the Fed Chair’s speech before rising sharply on the day itself, with the average daily range increasing to around 0.9%. Direction is far less consistent, with average DXY returns slightly negative on speech day but the median effectively flat.
AUD/USD shows a similar volatility pattern but a somewhat clearer directional bias. The pair has historically softened ahead of the speech before generating an average gain of around 0.3% on the day, while its average high-to-low range jumps to roughly 1.3%. As highlighted in my Jackson Hole FX returns and volatility preview, that suggests the event has been more dependable for delivering a larger trading range than predicting direction — particularly with AUD/USD already sitting close to key resistance
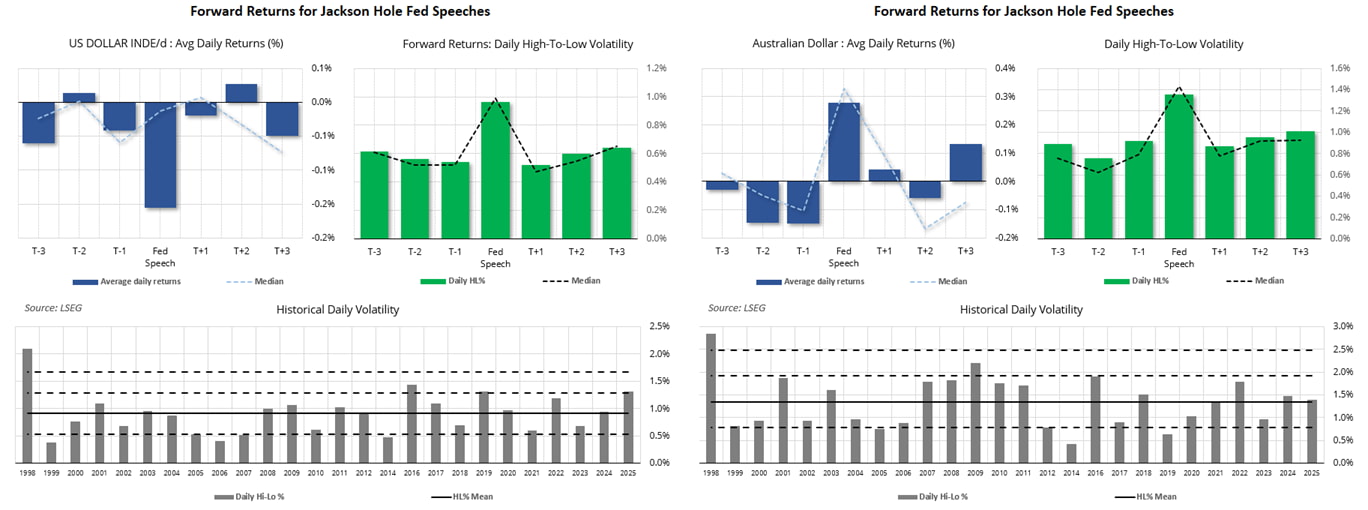
Source: LSEG
AUD/USD Technical Analysis: Australian Dollar vs US Dollar
Depending on which feed you follow, the Aussie has risen for eight consecutive weeks (according to Reuters) or five (via ICE). In either case, the rally has been impressive, and it is also accelerating — given last week’s rise was its most bullish in 18 weeks. That said, the broader trend in weekly volatility remains lower, while resistance looms around 72c and the May high — the latter of which seems likely to provide a decent level of resistance initially, if tested.
The daily chart shows AUD/USD resting on the monthly R2 pivot with a small bullish candle, as bulls ponder another crack at 72c while they await Australia’s inflation report. And should it come in hot, a move to 72c seems feasible. That said, if inflation were to soften even slightly and be followed by a slightly firmer US PCE report, then a break of Wednesday’s low would also clear the monthly R2 pivot and potentially see AUD/USD retrace towards its 10-day EMA (0.7115). Note that the 1-week implied volatility band suggests a 0.9% move in either direction with a 68% probability.
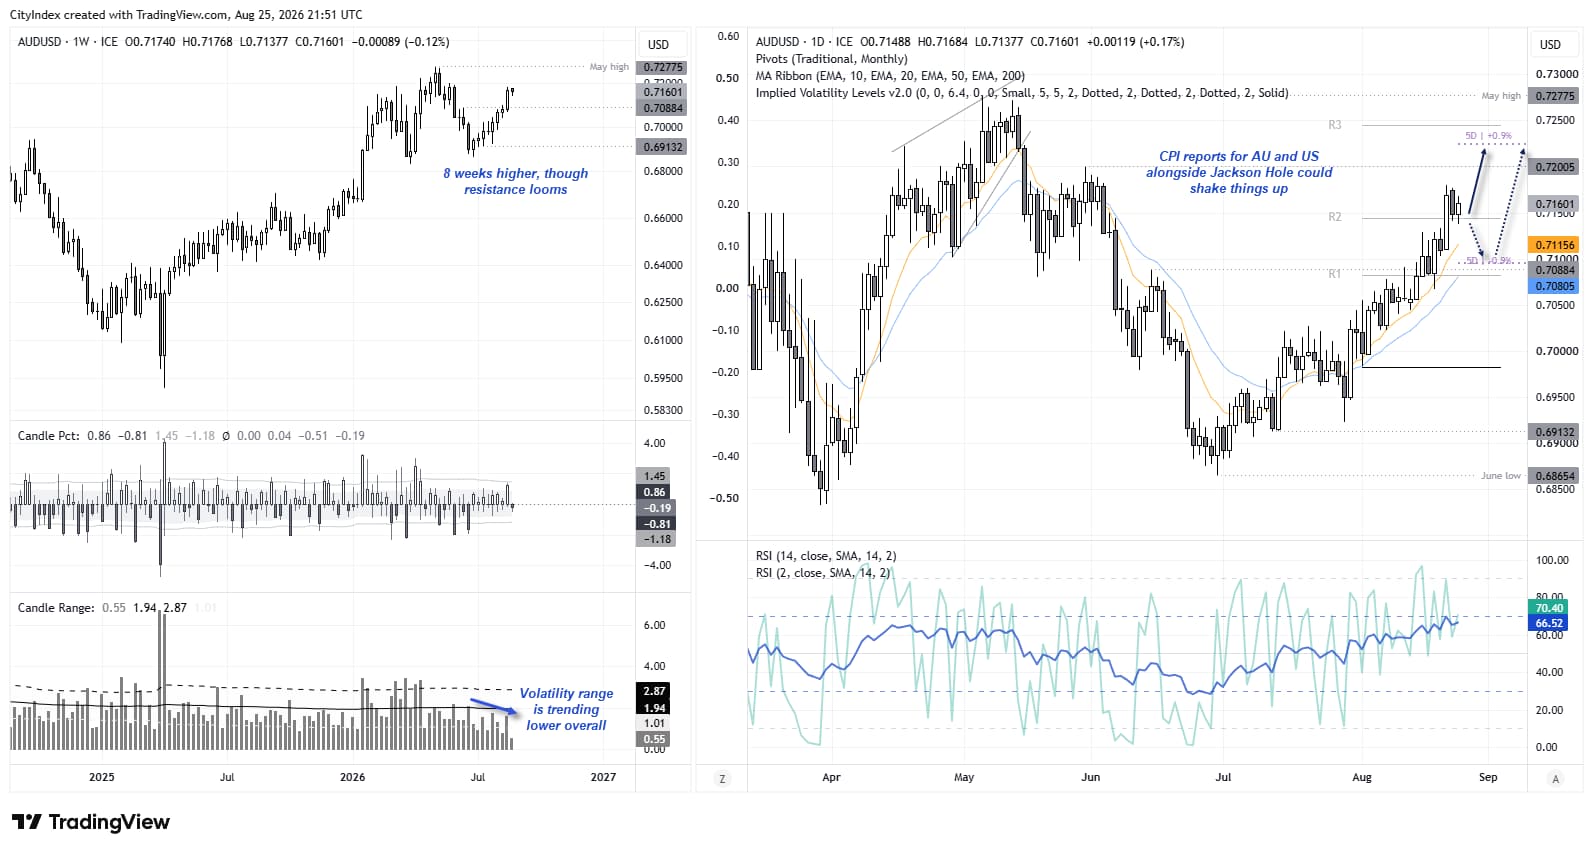
Source: ICE, TradingView
Related tags:


Open an account in minutes
Experience award-winning platforms with fast and secure execution.
Economic calendar
Web Trader platform
Our sophisticated web-based platform is packed with features.
Related articles
US Dollar Breakout Has History on Its Side
The US dollar is breaking higher as financial conditions tighten at a historically rapid pace. Both history and the charts suggest the rally may have further to run.

ASX 200 Outlook: Potential to Bounce Sits on a Knife Edge
ASX 200 bounce prospects remain on a knife edge as oversold technicals clash with weak financials, commodity pressures and global risk aversion.

US dollar rally loses yield support as Nvidia looms
US yields are retreating, but the dollar isn't following. With risk aversion potentially keeping it supported, Nvidia's results could determine whether emerging reversal signals in AUD/USD and EUR/USD develop further.
StoneX Financial Ltd (trading as "FOREX.com") is an execution-only service provider. This material, whether or not it states any opinions, is for general information purposes only and it does not take into account your personal circumstances or objectives. This material has been prepared using the thoughts and opinions of the author and these may change. However, FOREX.com does not plan to provide further updates to any material once published and it is not under any obligation to keep this material up to date.
This material is short term in nature and may only relate to facts and circumstances existing at a specific time or day. Nothing in this material is (or should be considered to be) financial, investment, legal, tax or other advice and no reliance should be placed on it. No opinion given in this material constitutes a recommendation by FOREX.com or the author that any particular investment, security, transaction or investment strategy is suitable for any specific person.
The material has not been prepared in accordance with legal requirements designed to promote the independence of investment research. Although FOREX.com is not specifically prevented from dealing before providing this material, FOREX.com does not seek to take advantage of the material prior to its dissemination. This material is not intended for distribution to, or use by, any person in any country or jurisdiction where such distribution or use would be contrary to local law or regulation. For further details see our full non-independent research disclaimer and quarterly summary.