
Australian Dollar Technical Outlook: AUD/USD Multi-Timeframe Analysis
The Australian dollar rally has run seven of the last eight weeks and is now stalling where three Fibonacci markers converge. Michael Boutros, StoneX Media Senior Market Analyst, walks the weekly, daily, and 4-hour charts to show where the advance is meeting resistance and what would confirm the next leg. The uptrend the Australian dollar lost in June has been acting as overhead resistance for three weeks running, and that broken slope now lands on the same region as a key retracement level. Momentum readings sit at their strongest since February while price has yet to close above the level that would confirm resumption. Behind the move, traders have pushed out their expectations for the Federal Reserve's next step, and the U.S. dollar has responded in kind.
This content was created by an affiliate of FOREX.com and represents the views and opinions of the author/speakers, not the views and opinions of Forex.com, StoneX Group Inc., or its subsidiaries. The content has not been independently reviewed by FOREX.com.

Key AUD/USD Economic Data Releases
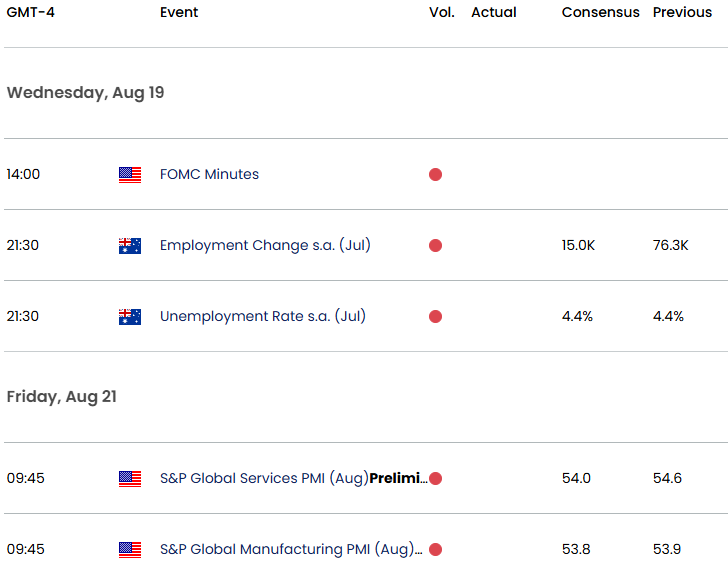
Economic Calendar - latest economic developments and upcoming event risk.
Active Short-term Technical Charts
- Gold Price Short-term Outlook: XAU/USD Breakout Faces a Defining Test
- US Dollar Short-term Outlook: USD Correction Pressures Pivotal Support
- Euro Short-term Outlook: EUR/USD Breakout Risk Builds Into Month-End
- Swiss Franc Short-term Outlook: USD/CHF Rally Presses Yearly Trend Resistance
- Canadian Dollar Short-term Outlook: USD/CAD Rebound Challenges the July Downtrend
- Japanese Yen Short-term Outlook: USD/JPY Defends the Uptrend as the Range Tightens
- British Pound Short-term Outlook: GBP/USD Breakout Attempts Major Trend Reversal
--- Written by Michael Boutros, Senior Technical Strategist
Follow Michael on X @MBForex