



Big Tech humbled by inflation, Nasdaq’s worst day since the Pandemic
It was a rough day for big tech following another hot US inflation print, with the Nasdaq suffering its worst day’s trade since March 2020.
Share this:

Yesterday’s inflation report was a quick reminder that complacency is the devil. Rising stocks and a weaker dollar were the tell-tale signs that investors thought a softer CPI print was practically a given, and the sharp reversal in sentiment was a lesson in humility. Particularly for tech stocks.
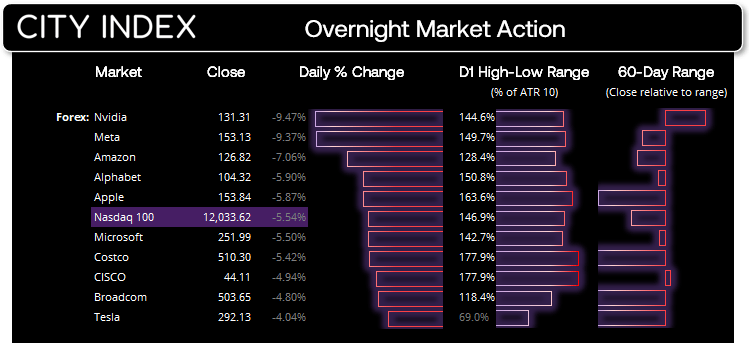
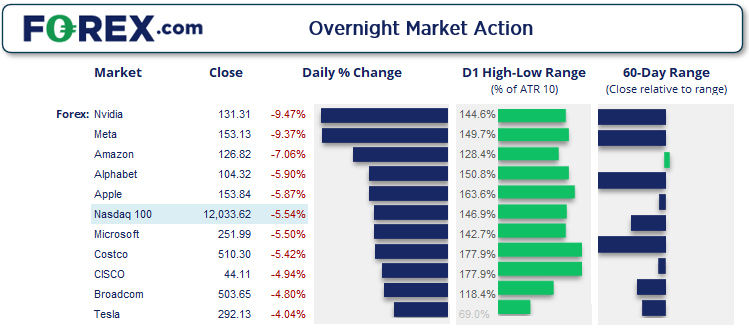
It was a sea of red for US equity markets with all major sectors falling lower. The Nasdaq 100 led declines on Wall Street by falling -5.5% during its worst day since the pandemic, with big tech names such as Nvidia, Meta and Amazon falling at least 7% and 9 of the top 10 (by market cap) stocks exceeding their average true ranges on the day. And when you see so many markets heading south, it comes with the potential for another leg lower and raises the question as to whether the recent rally was simply a bear-market bounce. If so, we may have seen a key swing high on the Nasdaq 100 in August around 13,720 and it is headed for new lows.
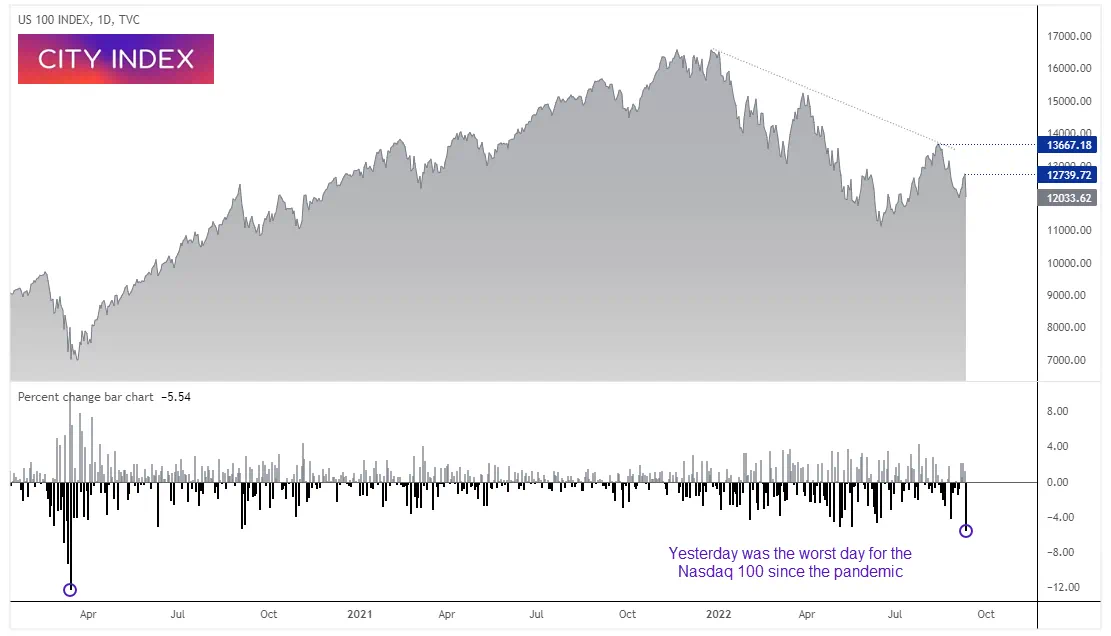
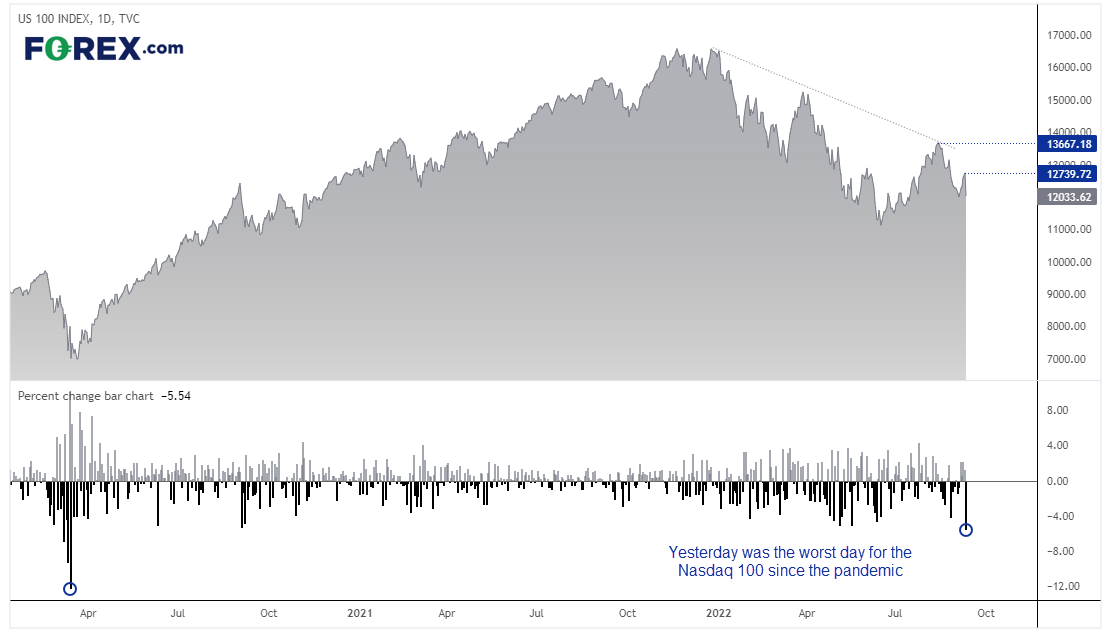
At current levels the Nasdaq is on track for a bearish engulfing week, and even if it somehow manages to rally into the weekend it would still be a bearish outside week should it close beneath 12,649 (which seems likely).
The Nasdaq hasn’t seen such a drawn since the beginning of the Nasdaq bubble
I have seen plenty of commentary recently that perhaps ‘the low’ has been seen for the year as its perfectly normal for stocks to fall 20-30% then revert to their longer-term bull trend. A quick look at the ‘drawdown form record highs’ chart on the Nasdaq begs to differ. The Nasdaq fell over 30% from its record high, which is a record not seen since the beginning of the Nasdaq bubble bursting in the earl 2000’s.
Since 2016 we have seen notable drawdowns of around -17%, -20% and -27% ahead of the recent -32%. The Nasdaq bubble fell over -80%, so even if this drawdown end up being just half of that, it could be headed for a move below 10,000.
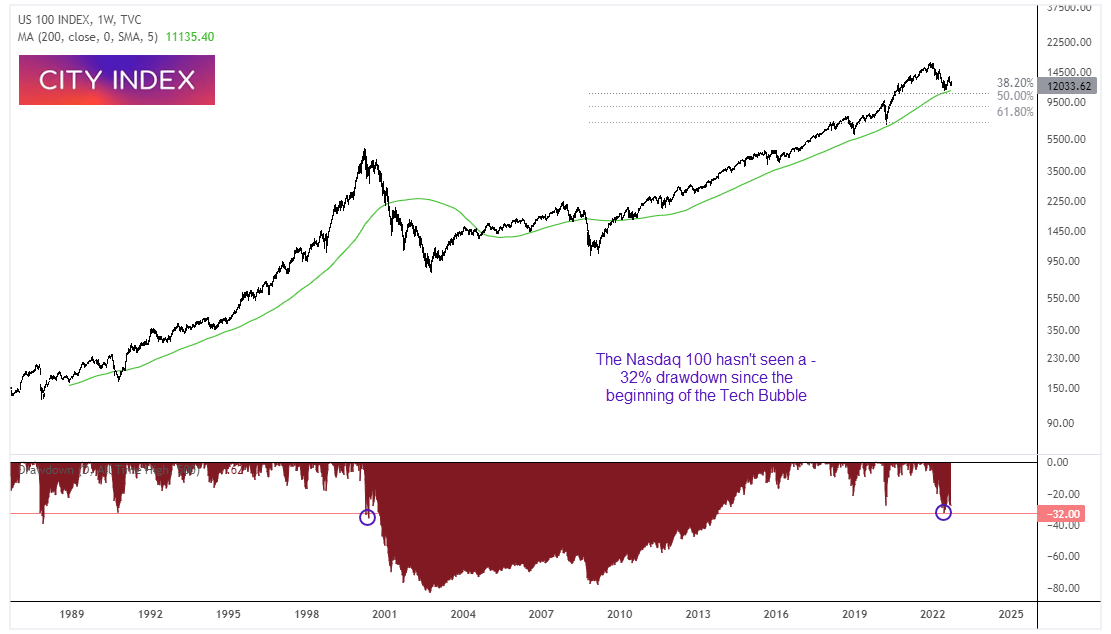
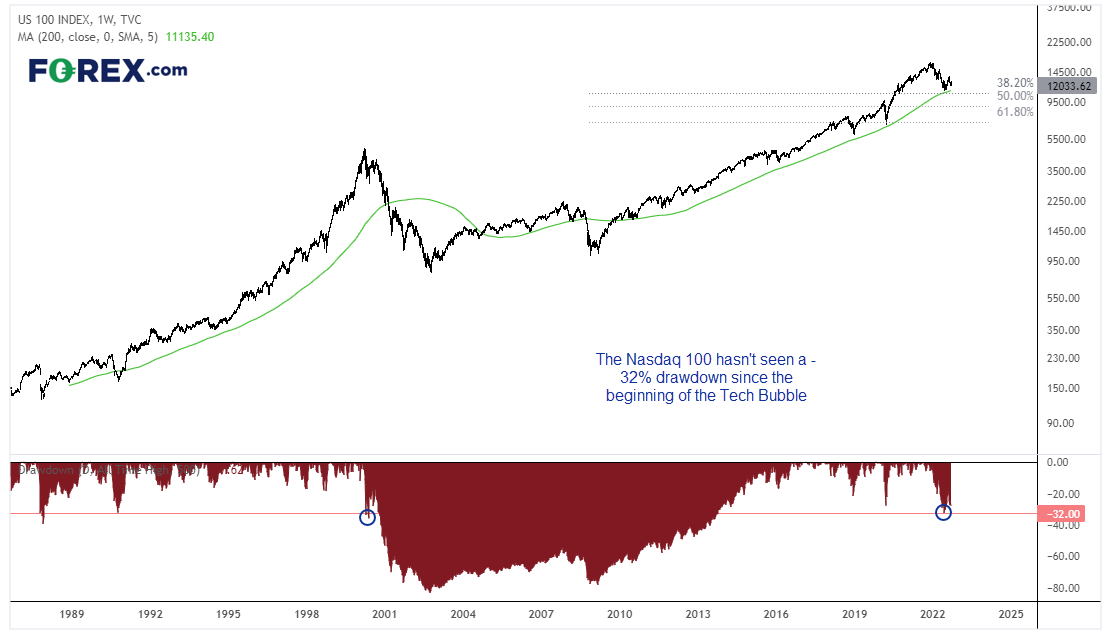
I’m not trying to be dramatic but simply look at the data and explore possibilities. Clearly markets remain sensitive to inflation data, so any inflationary ‘inputs’ to revive the hopes that inflation has topped could support stocks. But in the event the low is not yet in, there are some big tech stocks that look appealing to bearish eyes. Here are just two of them.
Nasdaq 100 trading guide
Nasdaq 100 trading guide
NVIDIA Corporation (NVDA) 1-hour chart:
From a technical standpoint, Nvidia likely ticks the most bearish boxes among the Nasdaq’s big tech fails. At current levels it is on track for a bearish engulfing week, has broken beneath its 50-week eMA and to a post-Pandemic low. It’s also fallen over 60% from its record high less than 10months ago, and whilst that may some cause for concern we could focus on the fact it has broken to new cycle lows on rising volume. As always, timeframes are important but from the daily chart perspective a move down to the pandemic low around 115 does not seem unreasonable.
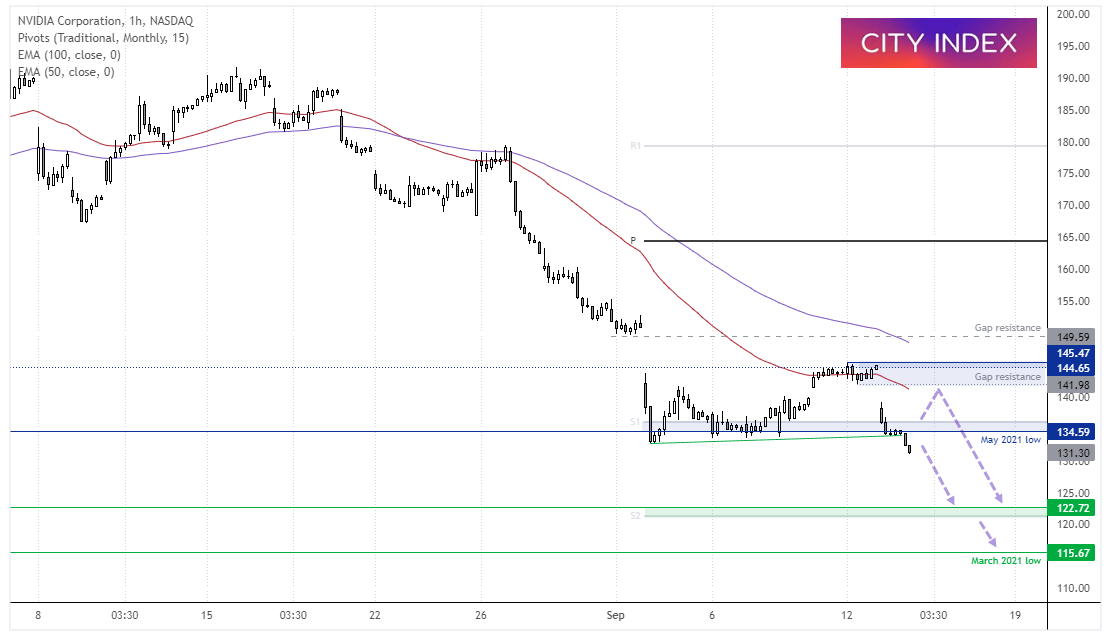
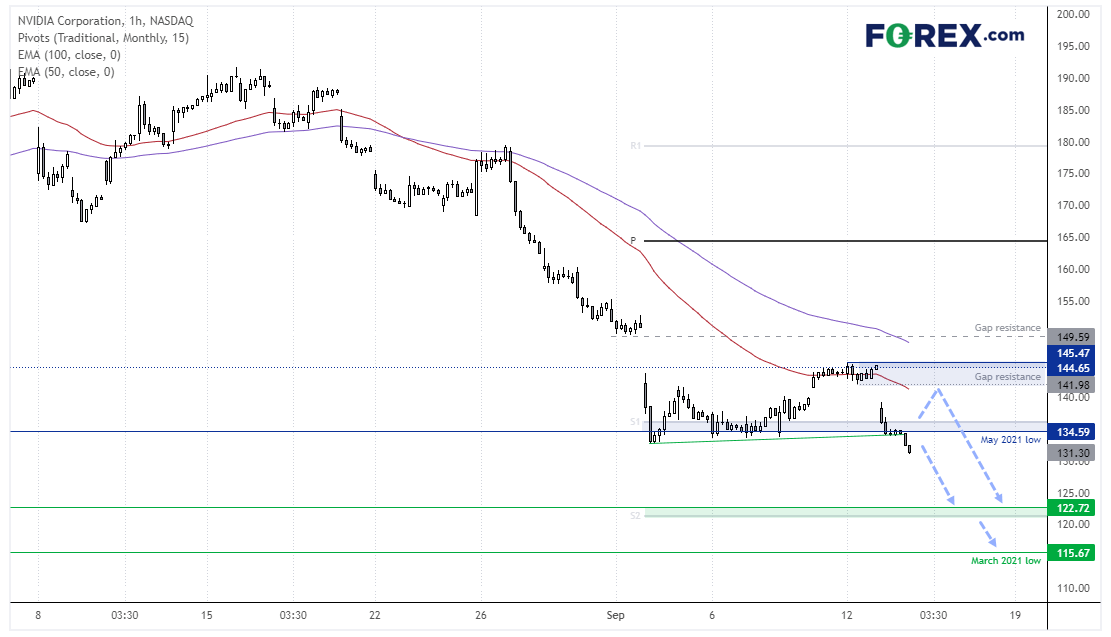
The 1-hour chart remains within an established bearish trend and momentum has clearly turned lower. Should we see any pullbacks today then we’d seek signs of weakness around the May 2021 low / monthly S1 pivot point for a potential swing high. The 122.72 low / monthly S1 pivot makes a likely interim target ahead of the March 2021 low.
Should prices break above 137 then a countertrend target for bulls to consider is gap resistance around 142.
Meta Platforms Inc (Meta) daily chart:
Meta is not faring much better than Nvidia, but we’ll take a stand back to admire the bigger picture. Meta is on track for a bearish outside week, and a monthly close beneath 154.25 confirms the July and August candles as bearish pinbars. The weekly chart is also on track for a bearish outside week, and the daily chart is trying to break beneath a key support level.
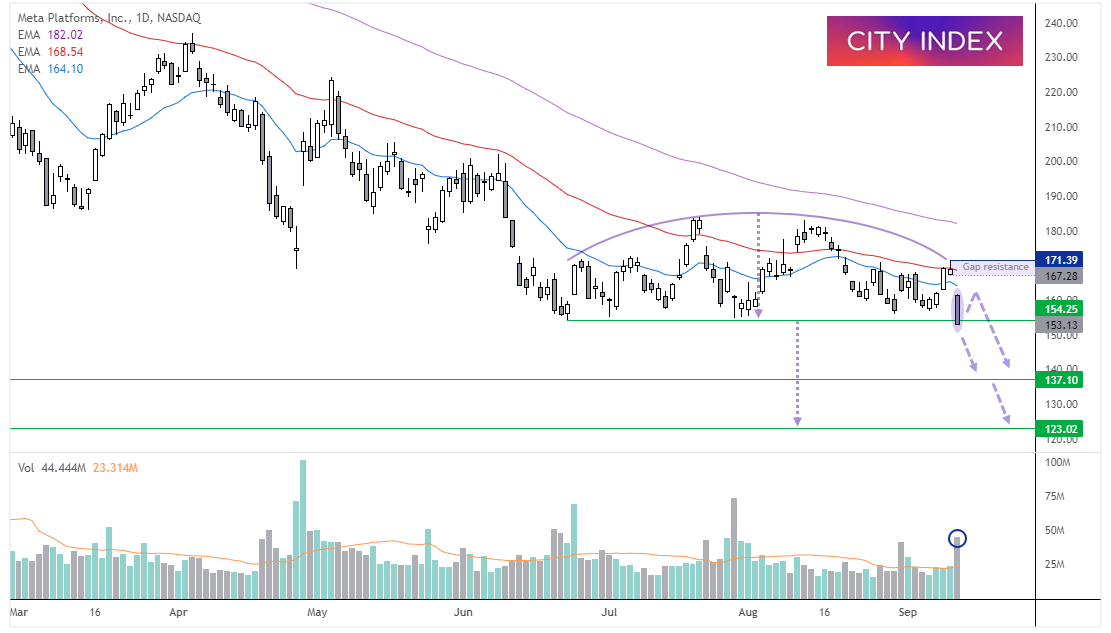
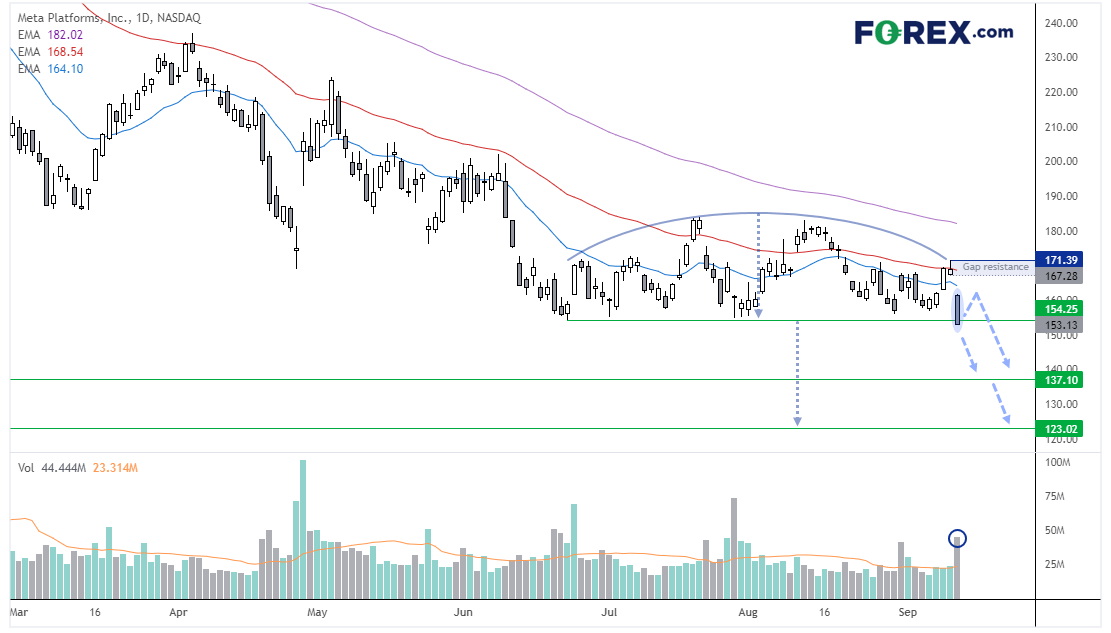
The daily chart has closed beneath a key level of support, but only by a cats whisker. Personally, I’d prefer to see more conviction to label it a convincing ‘breakout’, but we also saw heavy selling on the day. The daily chart is within an established downtrend and the consolidation pattern it is trying to break out of projects a target around 123.
A rally on high volume today places the stock on the backburner, but we would seek evidence of a potential swing high beneath gap resistance. Whereas a direct break of yesterday’s low (ideally on high volume) assumes bearish continuation, with the 137 – 140 support zone making a potential interim target on its way to 123.
How to trade with City Index
You can easily trade with City Index by using these four easy steps:
- Open an account, or log in if you’re already a customer
• Open an account in the UK
• Open an account in Australia
• Open an account in Singapore
- Search for the company you want to trade in our award-winning platform
- Choose your position and size, and your stop and limit levels
- Place the trade
How to trade with FOREX.com
Follow these easy steps to start trading with FOREX.com today:
- Open a Forex.com account, or log in if you’re already a customer.
- Search for the pair you want to trade in our award-winning platform.
- Choose your position and size, and your stop and limit levels.
- Place the trade.


Open an account in minutes
Experience award-winning platforms with fast and secure execution.
Economic calendar
Web Trader platform
Our sophisticated web-based platform is packed with features.
Related articles
China's steel slump leaves iron ore bulls under the pump
Iron ore has broken major support, threatening a return to the lows of 2022 as mounting evidence of weakness in China's steel sector reinforces the bearish outlook.

NZD/USD Forecast: Kiwi faces historic breakdown as RBNZ survey looms
NZD/USD is teetering above support that held through the pandemic and Liberation Day turmoil. With RBNZ hawks repeatedly disappointed, today's inflation expectations survey could open the door to a slide towards the GFC lows.

USD/JPY, AUD/JPY: Central Bank Divergence Creates Two-Way Risk
USD/JPY eyes a breakout above 160, while AUD/JPY faces further losses as Fed, RBA and BoJ interest rate expectations diverge.
StoneX Financial Ltd (trading as "FOREX.com") is an execution-only service provider. This material, whether or not it states any opinions, is for general information purposes only and it does not take into account your personal circumstances or objectives. This material has been prepared using the thoughts and opinions of the author and these may change. However, FOREX.com does not plan to provide further updates to any material once published and it is not under any obligation to keep this material up to date.
This material is short term in nature and may only relate to facts and circumstances existing at a specific time or day. Nothing in this material is (or should be considered to be) financial, investment, legal, tax or other advice and no reliance should be placed on it. No opinion given in this material constitutes a recommendation by FOREX.com or the author that any particular investment, security, transaction or investment strategy is suitable for any specific person.
The material has not been prepared in accordance with legal requirements designed to promote the independence of investment research. Although FOREX.com is not specifically prevented from dealing before providing this material, FOREX.com does not seek to take advantage of the material prior to its dissemination. This material is not intended for distribution to, or use by, any person in any country or jurisdiction where such distribution or use would be contrary to local law or regulation. For further details see our full non-independent research disclaimer and quarterly summary.