



BOC Preview: How much will the BOC hike?
Most are expected a hike of 50bps; however, some are hoping that it may hike as much as 75bps!
Share this:

The Bank of Canada meets on Wednesday to decide how much it should raise interest rates. When the central bank last met on March 2nd, it hiked interest rates by 25bps to 0.5%. This was the first time the BOC hiked rates since October 2018. At the time, the BOC also decided to maintain the current size of its balance sheet by reinvesting the proceeds of its government bonds until it deemed appropriate. Since then, Canada released its February CPI data. The print was 5.7% YoY vs 5.5% YoY expected and 5.1% YoY last. In addition, Canada also released its February and March Employment Change. The results were +336,600 and +72,500, respectively. With strong inflation and strong employment data, the BOC is sure to begin tapering its bond holdings. The only question for the central bank is “How much should they hike?”. Most are expected a hike of 50bps; however, some are hoping that it may hike as much as 75bps!
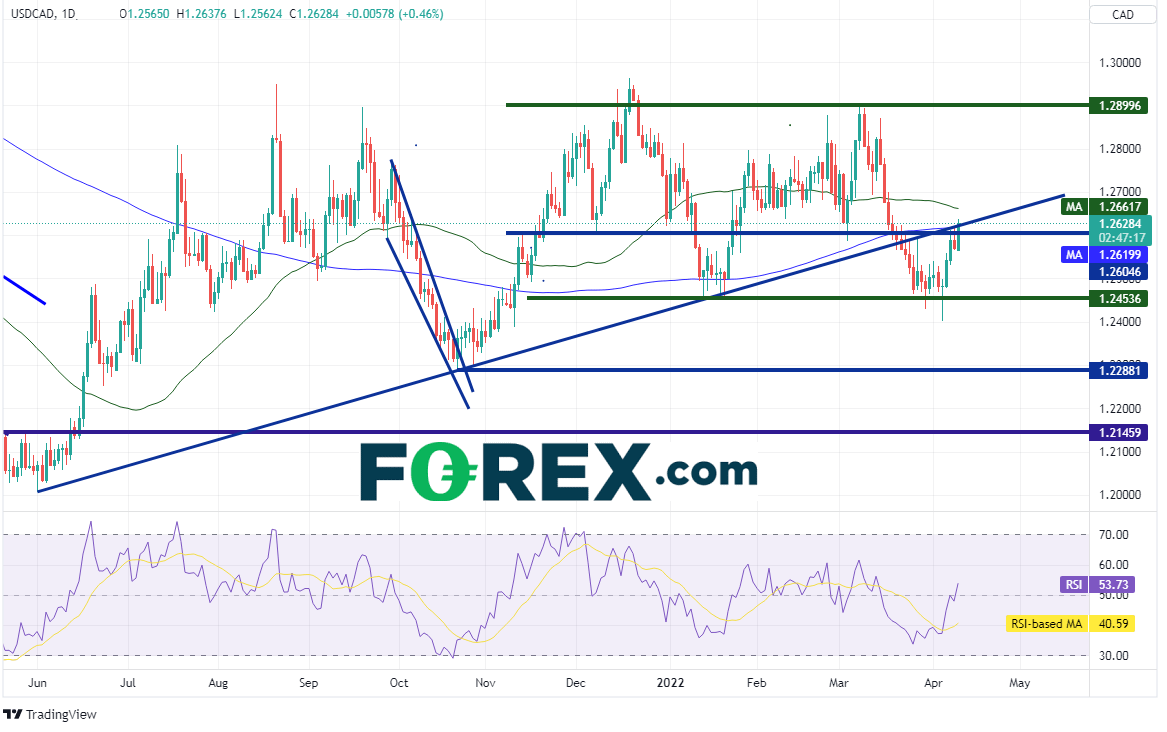
USD/CAD has been trading in a range since November 10th between 1.2454 and 1.2900. However, on April 5th, the pair tested the bottom of the range and failed, leaving a hammer candlestick on the daily timeframe. Hammers are reversal signals. The pair hasn’t looked back since and has formed a bullish engulfing candle today! In addition, USD/CAD traded above horizontal resistance, and upward sloping trendline dating to June 1st, 2021, and the 200 Day Moving Average, near 1.2620.
Source: Tradingview, Stone X
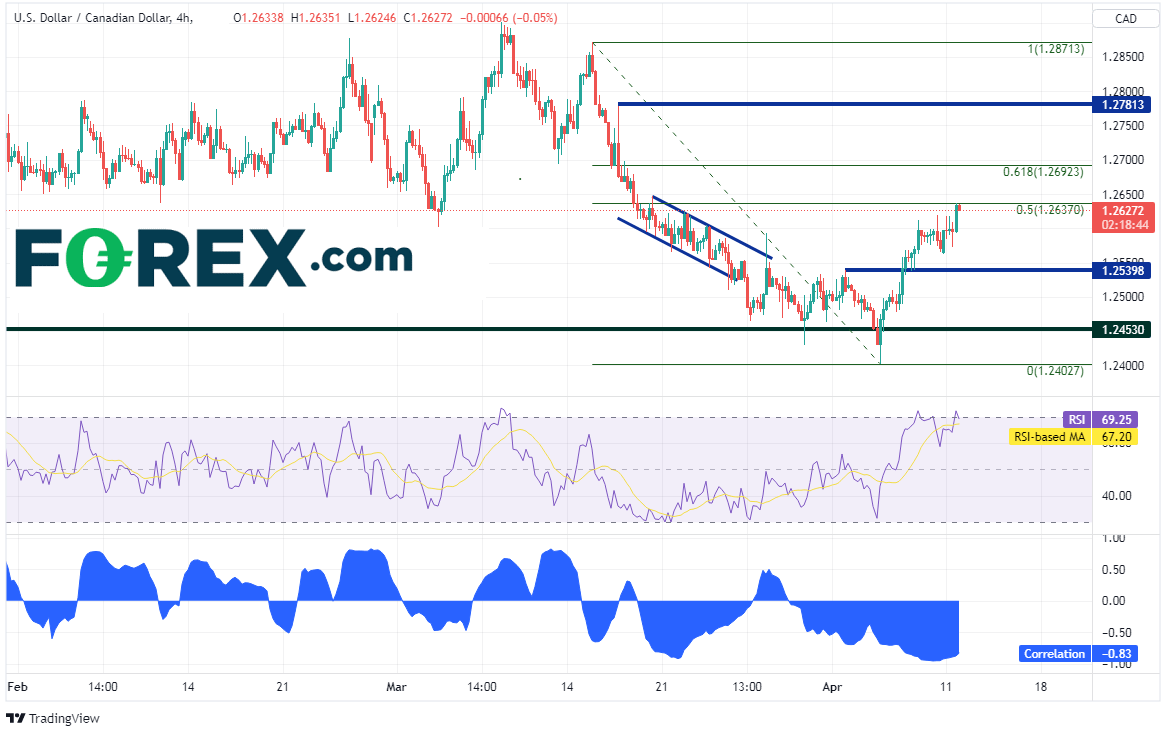
On a 240-minute timeframe, USD/CAD has retraced to the 50% level from the highs of March 15th to the lows of April 5th. First resistance is 50 Day Moving Average at 1.2660 (see daily), then the 61.8% Fibonacci retracement level from the March 15th high to the April 5th lows near 1.2692. Above there, price can trade to horizontal resistance at 1.2781. However, notice the RSI has moved into overbought territory, an indication price may be ready for a pullback. First support below the 200-Day Moving Average is horizontal support at 1.2540. Below there, price can drop to the April 5th lows near 1.2402.
Source: Tradingview, Stone X
Notice as well that USD/CAD and WTI Crude Oil have become highly negatively correlated once again with a correlation coefficient of -0.83. Any reading below -0.80 is considered a strong, negative correlation. (With Crude being so volatile over the last month, the correlation had fallen out of favor). Therefore, if one is looking for direction for USD/CAD, WTI Crude Oil may offer some help.
The Bank of Canada meets on Wednesday and is expected to hike interest rates. In addition, it is expected to begin to unwind its balance sheet. However, the markets will be waiting to see if the BOC hikes by 50bps or by 75bps.
The Bank of Canada meets on Wednesday to decide how much it should raise interest rates. When the central bank last met on March 2nd, it hiked interest rates by 25bps to 0.5%. This was the first time the BOC hiked rates since October 2018. At the time, the BOC also decided to maintain the current size of its balance sheet by reinvesting the proceeds of its government bonds until it deemed appropriate. Since then, Canada released its February CPI data. The print was 5.7% YoY vs 5.5% YoY expected and 5.1% YoY last. In addition, Canada also released its February and March Employment Change. The results were +336,600 and +72,500, respectively. With strong inflation and strong employment data, the BOC is sure to begin tapering its bond holdings. The only question for the central bank is “How much should they hike?”. Most are expected a hike of 50bps; however, some are hoping that it may hike as much as 75bps!
Everything you wanted to know about the Bank of Canada
USD/CAD has been trading in a range since November 10th between 1.2454 and 1.2900. However, on April 5th, the pair tested the bottom of the range and failed, leaving a hammer candlestick on the daily timeframe. Hammers are reversal signals. The pair hasn’t looked back since and has formed a bullish engulfing candle today! In addition, USD/CAD traded above horizontal resistance, and upward sloping trendline dating to June 1st, 2021, and the 200 Day Moving Average, near 1.2620.

Source: Tradingview, Stone X
Trade USD/CAD now: Login or Open a new account!
• Open an account in the UK
• Open an account in Australia
• Open an account in Singapore
On a 240-minute timeframe, USD/CAD has retraced to the 50% level from the highs of March 15th to the lows of April 5th. First resistance is 50 Day Moving Average at 1.2660 (see daily), then the 61.8% Fibonacci retracement level from the March 15th high to the April 5th lows near 1.2692. Above there, price can trade to horizontal resistance at 1.2781. However, notice the RSI has moved into overbought territory, an indication price may be ready for a pullback. First support below the 200-Day Moving Average is horizontal support at 1.2540. Below there, price can drop to the April 5th lows near 1.2402.

Source: Tradingview, Stone X
Notice as well that USD/CAD and WTI Crude Oil have become highly negatively correlated once again with a correlation coefficient of -0.83. Any reading below -0.80 is considered a strong, negative correlation. (With Crude being so volatile over the last month, the correlation had fallen out of favor). Therefore, if one is looking for direction for USD/CAD, WTI Crude Oil may offer some help.
The Bank of Canada meets on Wednesday and is expected to hike interest rates. In addition, it is expected to begin to unwind its balance sheet. However, the markets will be waiting to see if the BOC hikes by 50bps or by 75bps.
Learn more about forex trading opportunities.
Related tags:
Latest market news




Open an account in minutes
Experience award-winning platforms with fast and secure execution.
Economic calendar
Web Trader platform
Our sophisticated web-based platform is packed with features.
Related articles
DXY, GBP/USD, AUD/USD, USD/CAD, USD/JPY, Gold Weekly Technical Outlook 11 16 2026
Sr. Technical Strategist Michael Boutros highlights the levels that matter on the USD Majors, commodities, and equity indices charts this week.
Gold and silver forecast: Precious metals extend drop but seasonality hopes keeps bullish case alive
It has been a risk off session so far today with stocks, gold and especially silver (-4%) all taking a drop. Gold has fallen to a fresh 2026 low and its now more than $100 below the psychologically important $4,000 mark. A firmer US dollar, rising US rate expectations and fading safe-haven demand have combined to undermine the metal, despite continued central bank buying. This year has so far been a bad one for gold.

EUR/USD forecast: Dollar strength puts 1.1000 support in the spotlight | Currency Pair of the Week
The dollar extended its recent advance at the start of the week, with weakness across risk-sensitive assets reinforcing demand for the US currency. US equity futures slipped ahead of Nvidia’s earnings on Tuesday and an expected stock market debut by Anthropic later this week. Both events represent important tests for an AI trade that has become increasingly vulnerable to shifts in sentiment. In FX, EUR/USD nearly tested the psychologically important 1.1000 level, before bouncing modestly off its lows.
StoneX Financial Ltd (trading as "FOREX.com") is an execution-only service provider. This material, whether or not it states any opinions, is for general information purposes only and it does not take into account your personal circumstances or objectives. This material has been prepared using the thoughts and opinions of the author and these may change. However, FOREX.com does not plan to provide further updates to any material once published and it is not under any obligation to keep this material up to date.
This material is short term in nature and may only relate to facts and circumstances existing at a specific time or day. Nothing in this material is (or should be considered to be) financial, investment, legal, tax or other advice and no reliance should be placed on it. No opinion given in this material constitutes a recommendation by FOREX.com or the author that any particular investment, security, transaction or investment strategy is suitable for any specific person.
The material has not been prepared in accordance with legal requirements designed to promote the independence of investment research. Although FOREX.com is not specifically prevented from dealing before providing this material, FOREX.com does not seek to take advantage of the material prior to its dissemination. This material is not intended for distribution to, or use by, any person in any country or jurisdiction where such distribution or use would be contrary to local law or regulation. For further details see our full non-independent research disclaimer and quarterly summary.