



British Pound Price Action Setups: GBP/USD, GBP/JPY, EUR/GBP
It’s a big week for the British Pound, along with the USD, JPY and Euro, as each economy has a central bank rate decision and two of those banks may be looking to hike rates in the coming months.
Share this:


In early April I looked at the British Pound as compared to the Euro, saying that I though Cable looked like a cleaner backdrop for USD-weakness than what had shown in EUR/USD. At the base of that thesis was the EUR/GBP cross pair, which had just made a trip up to a resistance area linked to a Fibonacci retracement level. Since then, GBP strength has taken over and especially over the past few days, with another run of USD weakness hitting, GBP/USD has taken on a brighter tone than the EUR/USD major pair.
In GBP/USD, a falling wedge formation built last week as sellers were slow at support but aggressive on bounces at lower-high resistance. That wedge broke out decisively on Friday, with the run continuing through early trade this week. Price has pushed up toa familiar resistance level of 1.3568, and that’s since produced a pullback with a couple of elongated upper wicks, illustrating sellers’ response to bulls attempt at running up to the 1.3600 level that remains an elusive spot for the pair.
GBP/USD Four-Hour Chart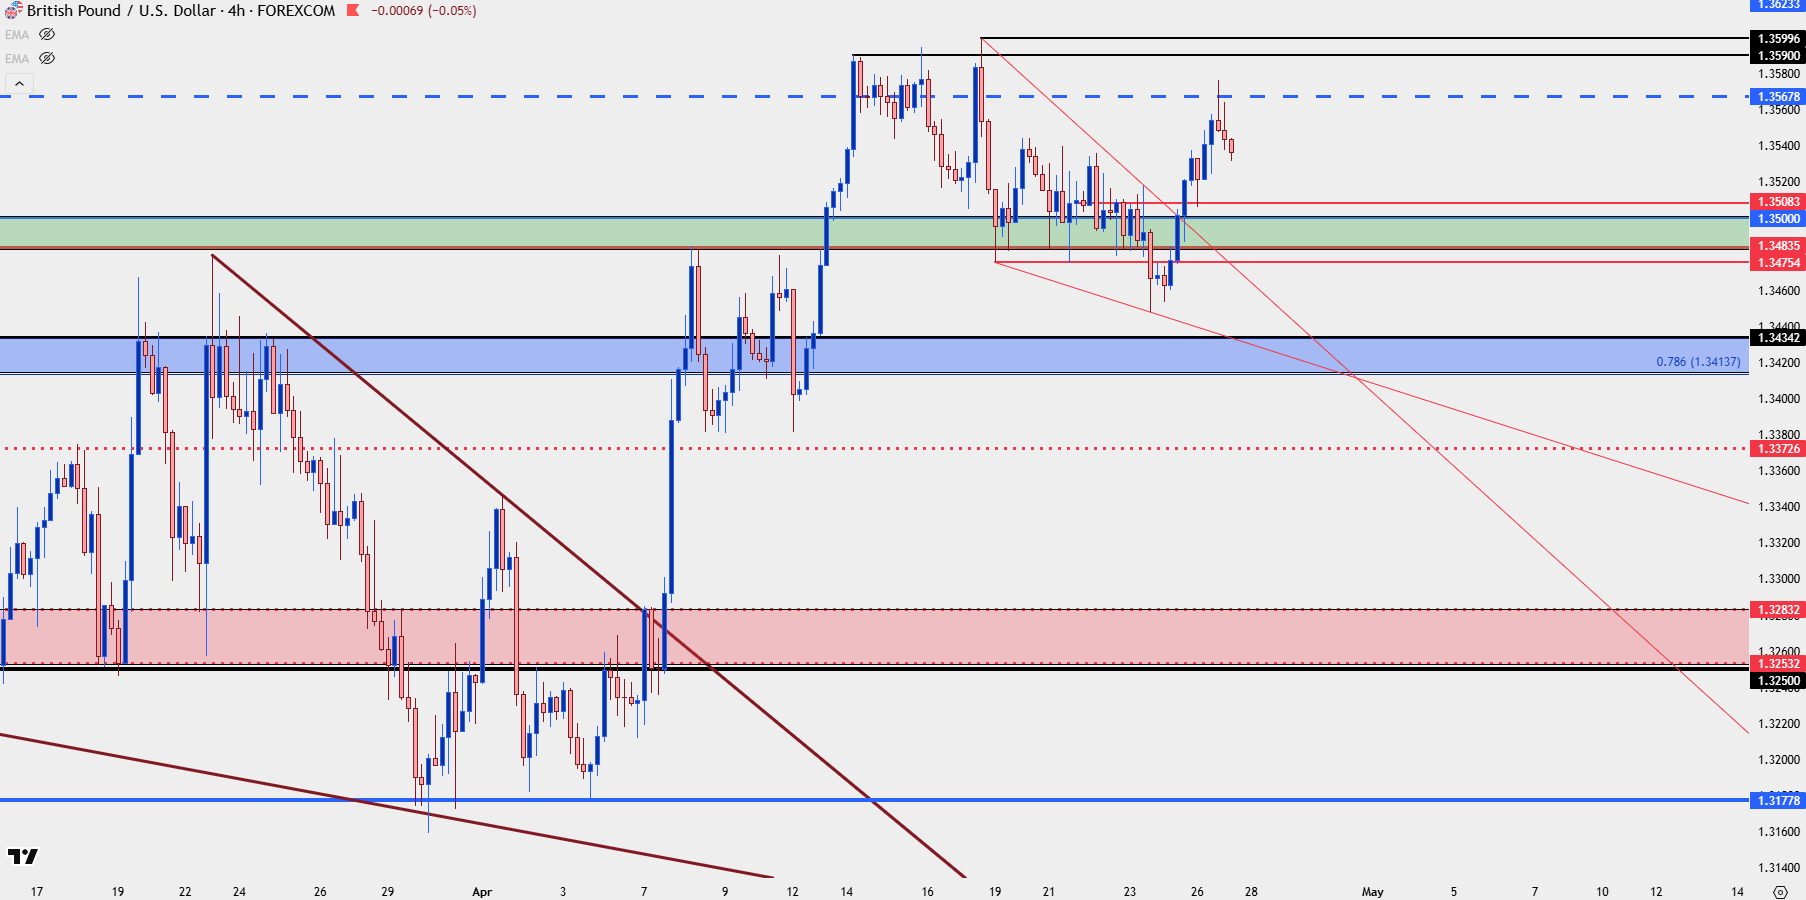
Chart prepared by James Stanley; data derived from Tradingview
From the above chart, we can see that the 1.3484-1.3500 zone remains of interest as this could set up higher-low support on subsequent pullback setups, with buyers showing up to defend last week’s lower-low.
But, for GBP strength there may be another area of note against the Japanese Yen as we approach a Bank of Japan rate decision.
GBP/JPY
I looked into GBP/JPY a couple of times last week as the pair had pushed back above the 215.00 level, and that line-in-the-sand held as support for three consecutive days to finish last week, with buyers making a push up to a fresh 17-year high in early trade for this week.
GBP/JPY Daily Chart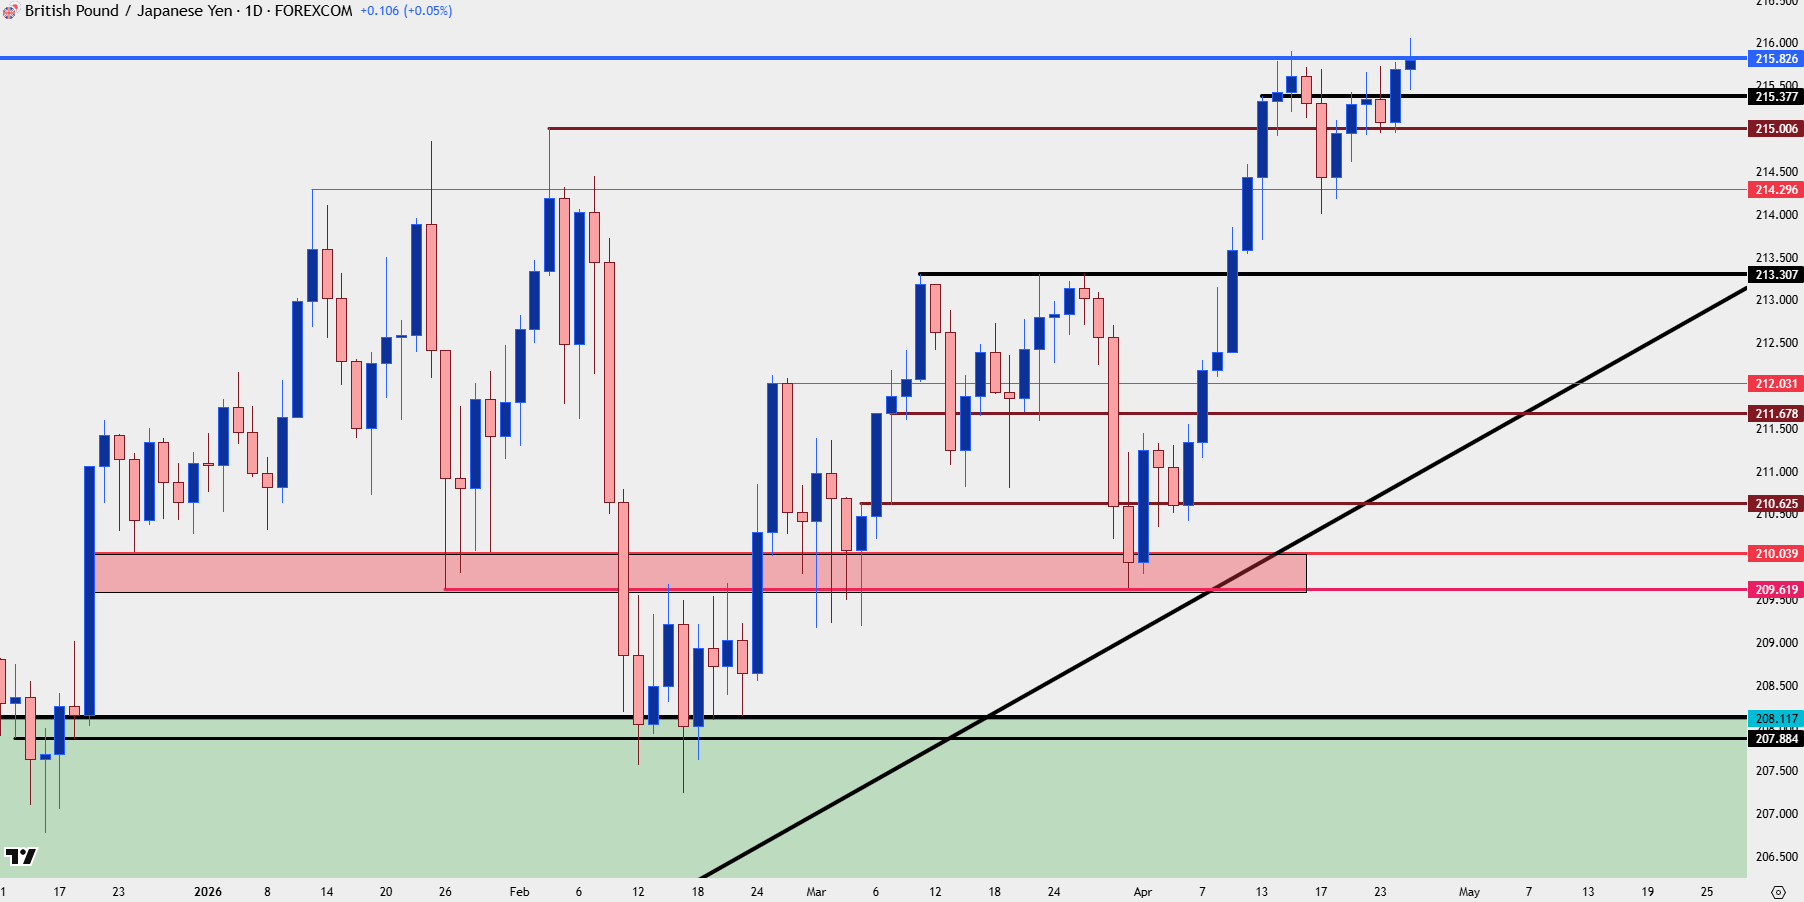
Chart prepared by James Stanley; data derived from Tradingview
GBP/JPY Shorter-Term
From the four-hour we can get better view of that support hold at 215 as there were multiple underside wicks that grasped on to that price, with buyers ultimately prevailing as follow-through hit after the weekly open. So far, however, bulls haven’t been able to sustain the move above the 215.83 level that was also looked at last week and this has reference back to 2008, and given the gravity of headline events in the next few days, if we do see a pullback here there’s now the possibility of higher-low support at the 215.38 level. If that doesn’t hold, 215 is back on the radar and if that gets slipped through, especially if it’s after the BoJ but before the BoE, caution should be utilized as something may be shifting around JPY themes.
GBP/JPY Four-Hour Chart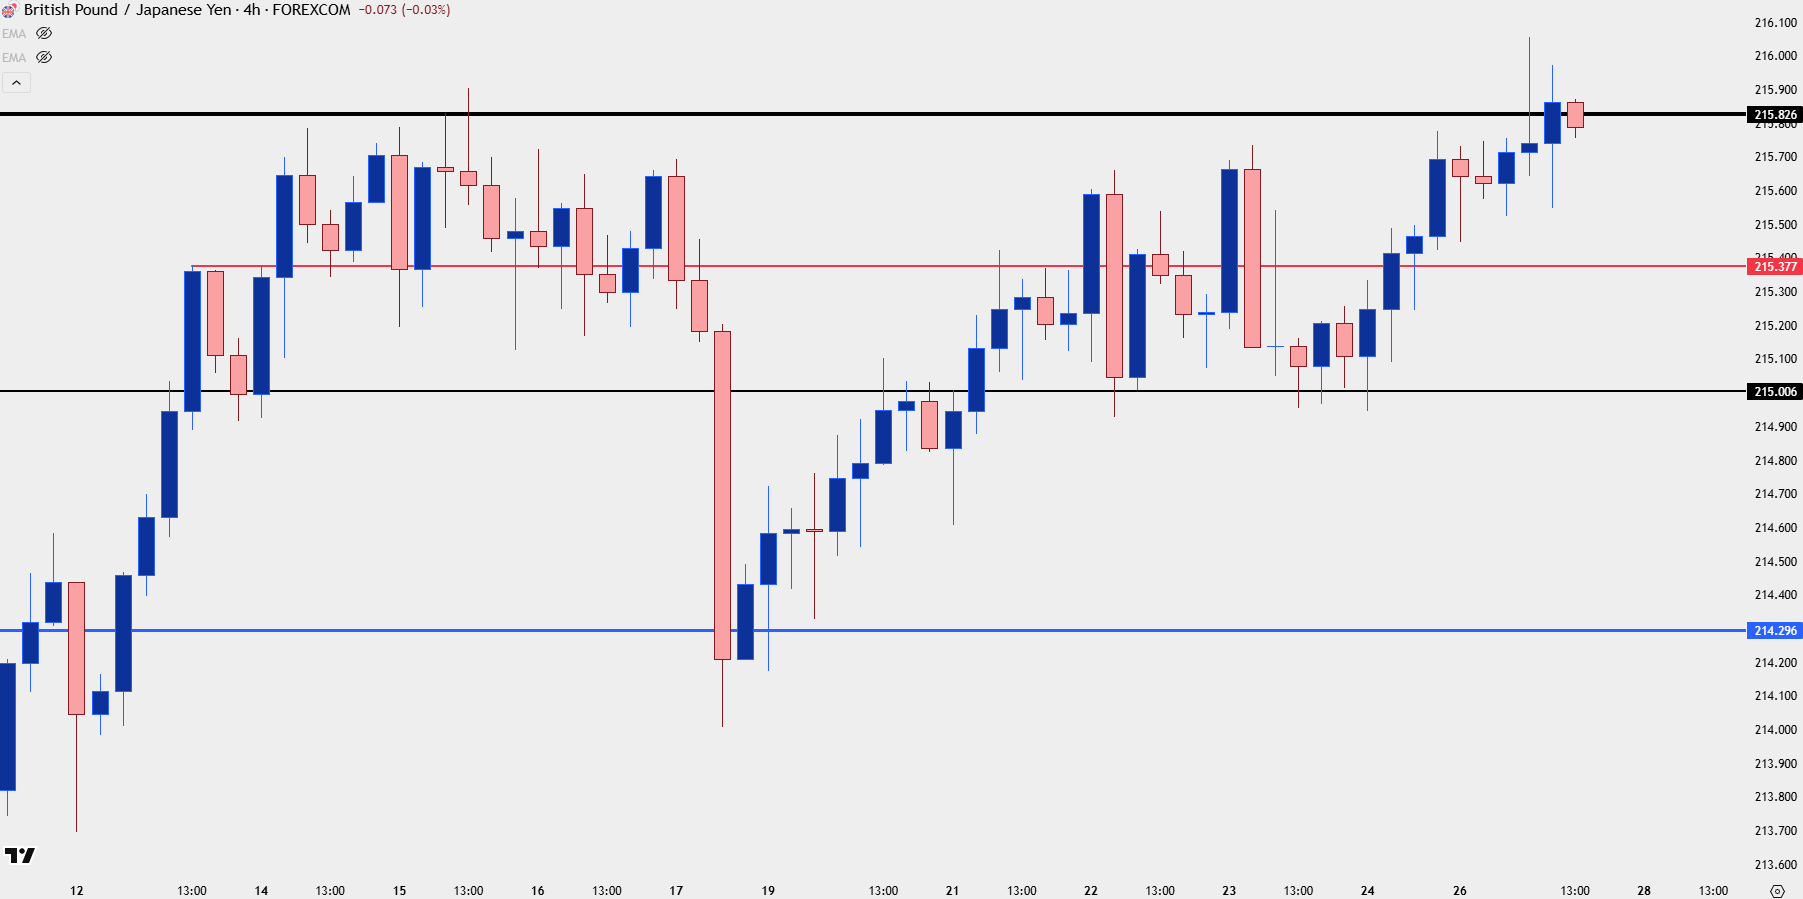
Chart prepared by James Stanley; data derived from Tradingview
EUR/GBP
In the cross pair it was the resistance zone from 0.8739-0.8753 that came into play in early-April and ultimately helped to tip the flow from EUR/USD to GBP/USD.
As looked at closely coming into the month, EUR/USD had retained more viable bullish structure than GBP/USD, but given the resistance in the cross pair the prospect of that shifting was gaining in attraction. That ultimately took place shortly after and at this point, we can see where prices have continued to tip down and there’s now a big spot of possible support a little lower, around 0.8628 that’s getting close by.
If that comes into play, then there may be an attractive point to anticipate a shift, where EUR/USD and EUR/JPY could take preference for strength over GBP/USD and GBP/JPY. We’re not quite there at this point, but if the ECB sounds more-hawkish than expected on Thursday that could definitely begin to show.
Until then, the range remains in play.
EUR/GBP Daily Price Chart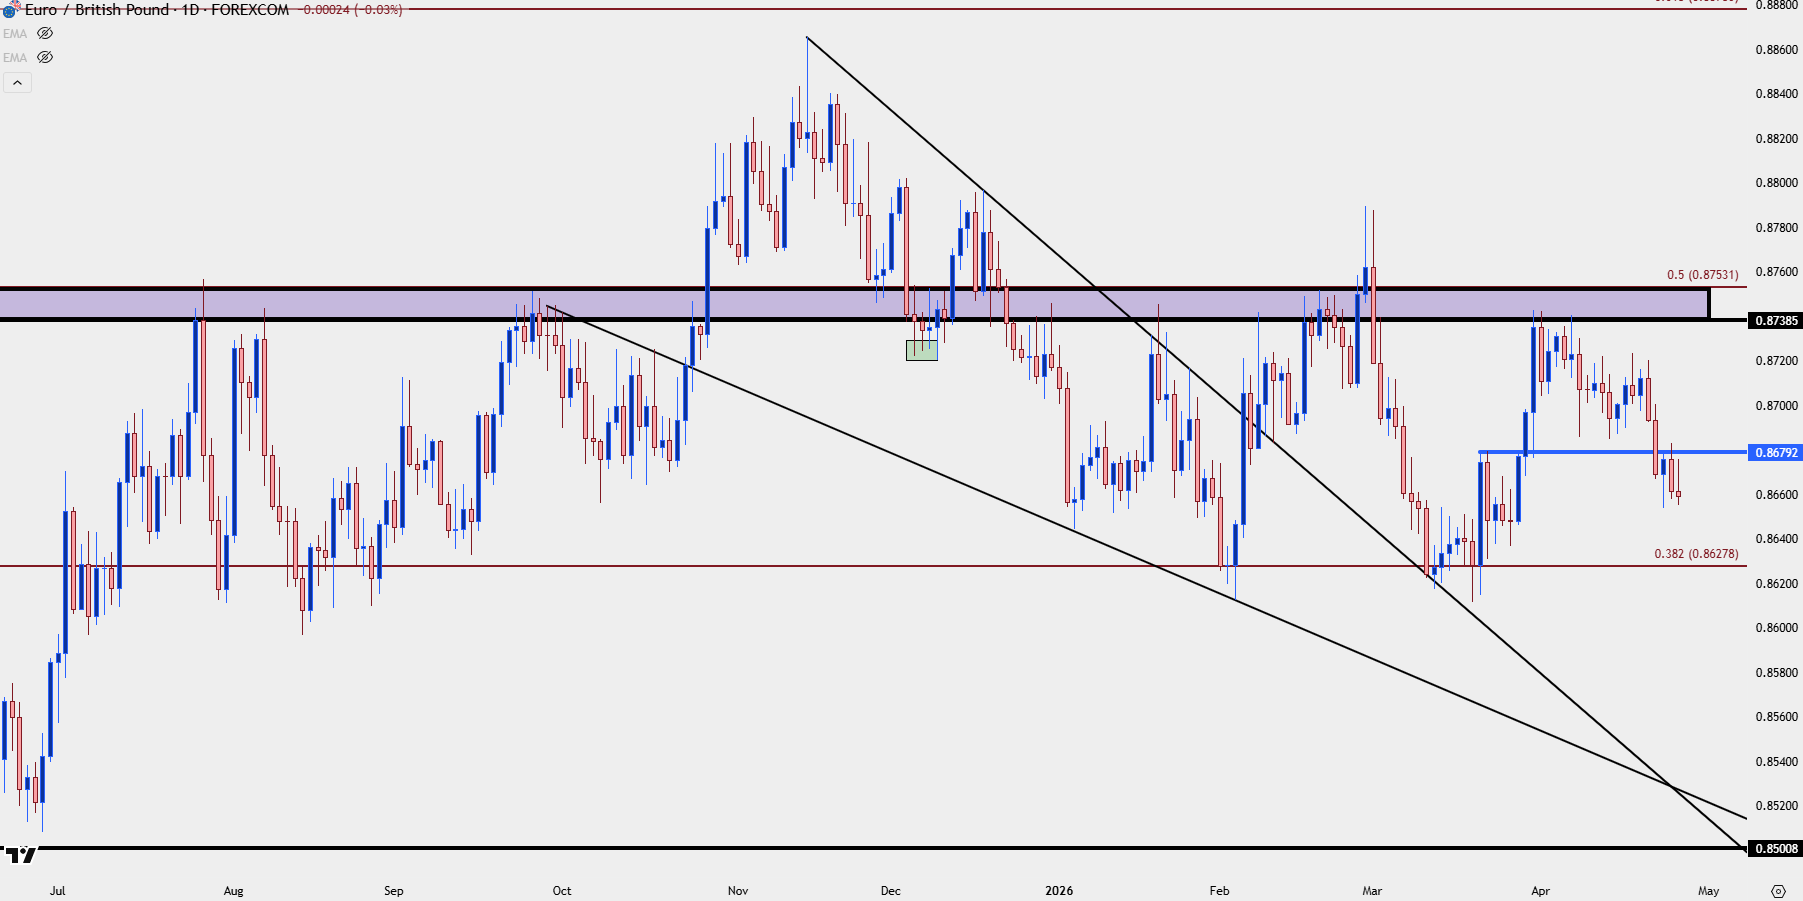
Chart prepared by James Stanley; data derived from Tradingview
--- written by James Stanley, Senior Market Analyst, Global Macro
Related tags:


Open an account in minutes
Experience award-winning platforms with fast and secure execution.
Economic calendar
Web Trader platform
Our sophisticated web-based platform is packed with features.
Related articles

DXY, GBP/USD, AUD/USD, USD/CAD, USD/JPY, Gold Weekly Technical Outlook 11 16 2026
Sr. Technical Strategist Michael Boutros highlights the levels that matter on the USD Majors, commodities, and equity indices charts this week.


S&P, Nasdaq Slide as NVDA, AI Worries Continue to Build
It was a busy weekend in the headlines as a campaign to bring back Jensen Huang atop NVDA gained steam, even with accusations of possible treason and a circular funding model that has started to raise questions.

S&P 500, Nasdaq 100 Claw Back But NVDA Cloud Looms Overhead
Last week was green for both the Nasdaq and S&P 500 but given the sell-off that led into that bounce there’s still a very real question as to whether bears still have a statement to make. And the NVDA situation presents a very real threat.
StoneX Financial Ltd (trading as "FOREX.com") is an execution-only service provider. This material, whether or not it states any opinions, is for general information purposes only and it does not take into account your personal circumstances or objectives. This material has been prepared using the thoughts and opinions of the author and these may change. However, FOREX.com does not plan to provide further updates to any material once published and it is not under any obligation to keep this material up to date.
This material is short term in nature and may only relate to facts and circumstances existing at a specific time or day. Nothing in this material is (or should be considered to be) financial, investment, legal, tax or other advice and no reliance should be placed on it. No opinion given in this material constitutes a recommendation by FOREX.com or the author that any particular investment, security, transaction or investment strategy is suitable for any specific person.
The material has not been prepared in accordance with legal requirements designed to promote the independence of investment research. Although FOREX.com is not specifically prevented from dealing before providing this material, FOREX.com does not seek to take advantage of the material prior to its dissemination. This material is not intended for distribution to, or use by, any person in any country or jurisdiction where such distribution or use would be contrary to local law or regulation. For further details see our full non-independent research disclaimer and quarterly summary.