



Could oil end its 5 day losing run
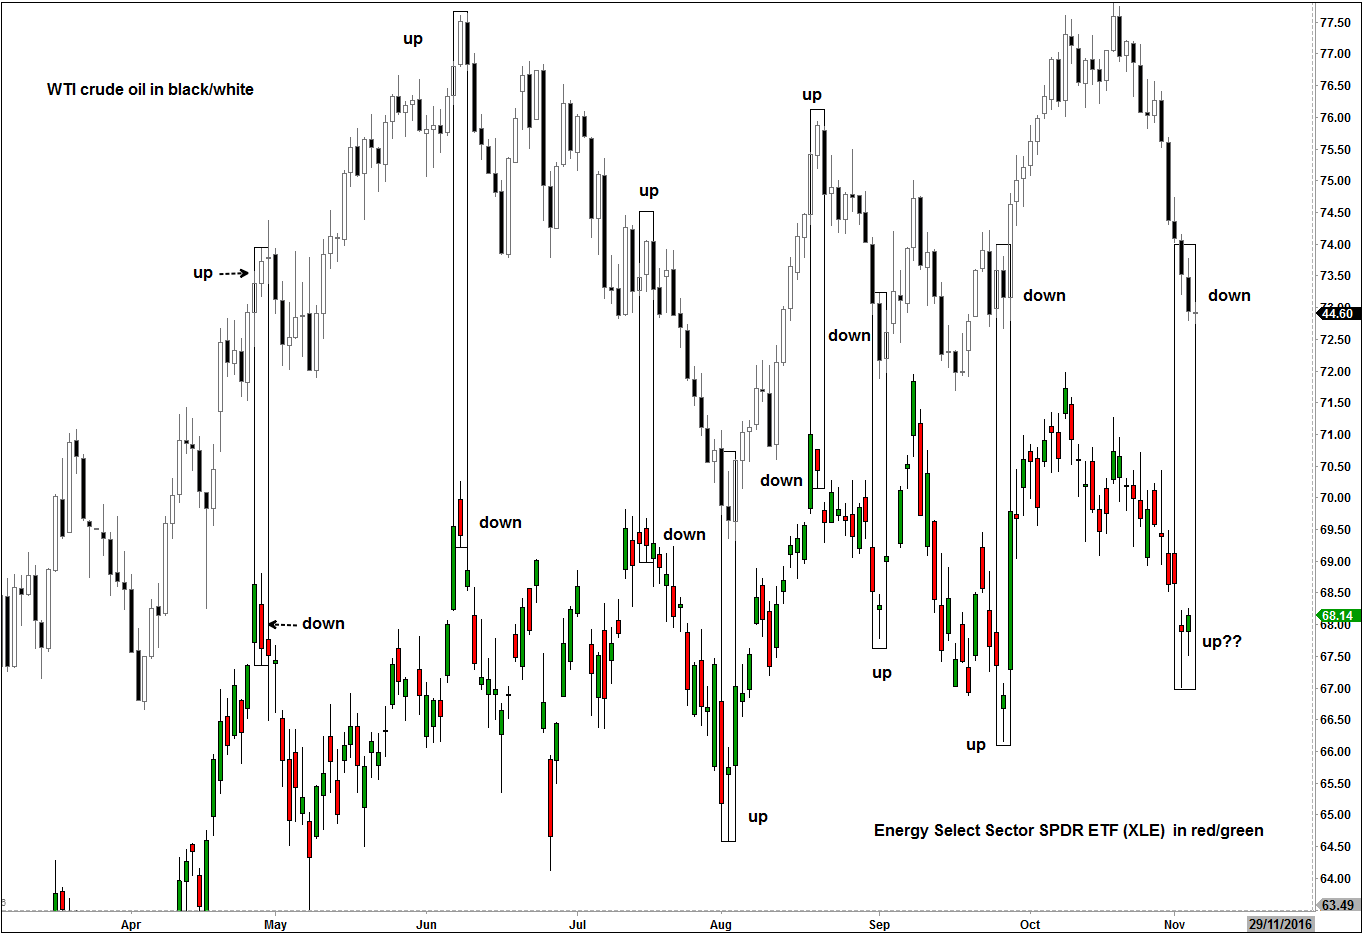
There are tentative signs that crude oil prices could bounce back today after falling for 5 consecutive and 9 in the past 11 days. As well as oil prices being oversold, bearish speculators may reduce their exposures ahead of the weekend. What's more, the Energy Select Sector SPDR ETF (XLE) has actually held its own relatively well in the past couple of days.
Share this:

There are tentative signs that crude oil prices could bounce back today after falling for 5 consecutive and 9 in the past 11 days. As well as oil prices being oversold, bearish speculators may reduce their exposures ahead of the weekend. What’s more, the Energy Select Sector SPDR ETF (XLE) has actually held its own relatively well in the past couple of days. This divergence is definitely noteworthy given that the XLE has led WTI prices many times recently as highlighted on the chart.
The XLE created what may be considered as a potential reversal candlestick price pattern on Wednesday and it closed higher on Thursday. Oil prices on the other hand have weakened sharply during this period. So are speculators in the oil ETF wrong or those in actual oil futures? Judging by the chart, it could be argued that the selling in oil prices may have been overdone a little. But with that record rise in weekly US oil stocks and not to mention the OPEC shenanigans, who could blame oil traders for feeling so bearish?
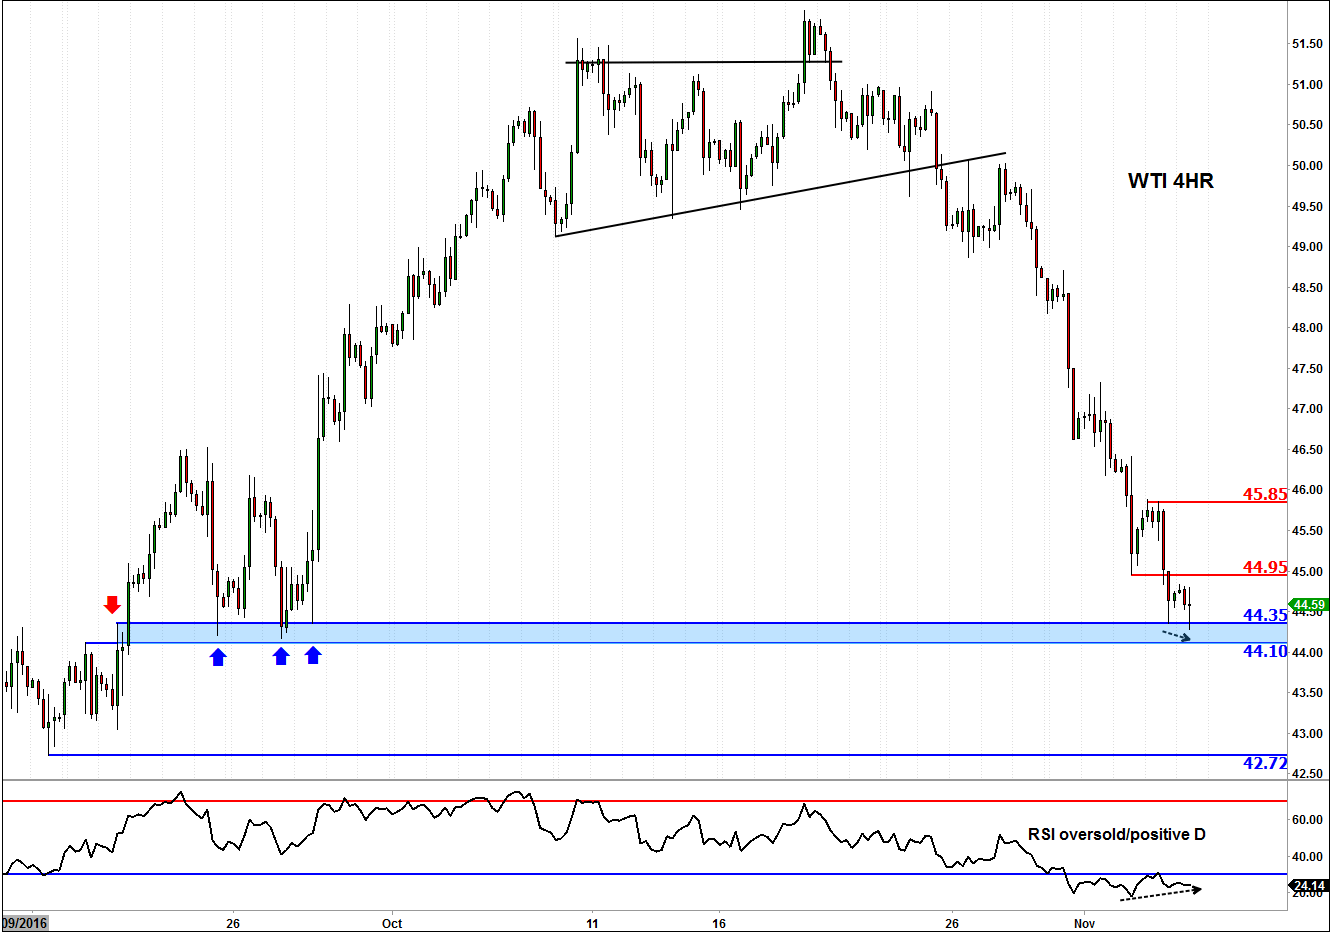
Now looking at the 4-hour chart of WTI we can see that US oil prices have pulled back quite sharply to a previous key support and resistance area between $44.10-44.35. While I am not suggesting that prices will bottom out here, there is an increased likelihood that we will see a bounce of some sort. Already, WTI has bounced off its lows from this $44.10-£44.35 range and it has climbed back above Thursday’s low. Momentum-based traders may also notice the positive divergence on the Relative Strength Index (RSI) which has also drifted below the ‘oversold’ territory of 30.
Thus, the short-term technical indications do point to a bounce in oil prices. If prices do go up, traders will then need to watch the reaction around some short-term resistance levels in order to gauge the strength of the bounce. For example, if a resistance level like $44.95/45.00 breaks down with ease then this would point to a more decent recovery than a mere dead-cat bounce. Conversely, if oil prices spend a long time trying to recover but fail to convincing move higher then that would be bearish. In this case, the RSI and other oscillators will move higher from these low levels through time rather than price, meaning that momentum traders would also no longer interpret prices as being oversold even though they have failed to bounce back meaningfully.
In any case, this potentially short-term bullish outlook will become invalid if the support level at $44.10 breaks down and price holds below it. If this were to happen then the prior low around the $42.70/5 area would become the next bearish objective.
Source: eSignal and FOREX.com. Please note, this product is not available to US clients
Source: eSignal and FOREX.com.
Latest market news




Open an account in minutes
Experience award-winning platforms with fast and secure execution.
Economic calendar
Web Trader platform
Our sophisticated web-based platform is packed with features.
Related articles

Nasdaq 100 Forecast: NDX falls ahead of Nvidia’s earnings & Anthropic’s debut this week
U.S. stocks are heading for a weaker open amid a challenging macro backdrop and with AI-linked stocks once again under pressure ahead of Nvidia's results later this week. Attention is also turning to Anthropic's highly anticipated IPO.


Crude Oil Weekly Outlook: Geopolitics vs Oversupply Risks
Crude Oil Weekly Outlook: The IEA has flagged the risk of an oil supply surplus since the Iran war began. Yet WTI and Brent have held onto bullish rebounds from key support near 84 and 89, respectively, as geopolitical risks persist.

S&P 500 forecast: SPX struggles for direction ahead of PPI data
U.S. stocks are struggling for direction on Friday as investors continue to weigh up the fallout from Nvidia’s leadership change, rising Treasury yields and the upcoming U.S. producer price inflation data.
StoneX Financial Ltd (trading as "FOREX.com") is an execution-only service provider. This material, whether or not it states any opinions, is for general information purposes only and it does not take into account your personal circumstances or objectives. This material has been prepared using the thoughts and opinions of the author and these may change. However, FOREX.com does not plan to provide further updates to any material once published and it is not under any obligation to keep this material up to date.
This material is short term in nature and may only relate to facts and circumstances existing at a specific time or day. Nothing in this material is (or should be considered to be) financial, investment, legal, tax or other advice and no reliance should be placed on it. No opinion given in this material constitutes a recommendation by FOREX.com or the author that any particular investment, security, transaction or investment strategy is suitable for any specific person.
The material has not been prepared in accordance with legal requirements designed to promote the independence of investment research. Although FOREX.com is not specifically prevented from dealing before providing this material, FOREX.com does not seek to take advantage of the material prior to its dissemination. This material is not intended for distribution to, or use by, any person in any country or jurisdiction where such distribution or use would be contrary to local law or regulation. For further details see our full non-independent research disclaimer and quarterly summary.