





Crude oil drifts into pivotal level, bears circle gold: European Open
WTI crude is trying to rise for a third day in line with my bullish bias, although resistance nearby hints at a pullback at the least. Momentum for gold has turned lower, and it looks like bears may not quite be done yet.
Share this:

China’s annual rate of inflation fell at its fastest pace in 14 years at -0.8% y/y. Whilst this is not a great sign for growth from the second largest economy, it shows how strong deflationary forces are – and this has excited APAC indices which rallied on the back of dovish central bank expectations. The Nikkei tracked Wall Street’s rally and trades just -0.3% from its 24-year high set late January. The Shenzhen composite is the session leader at +3% on the day.
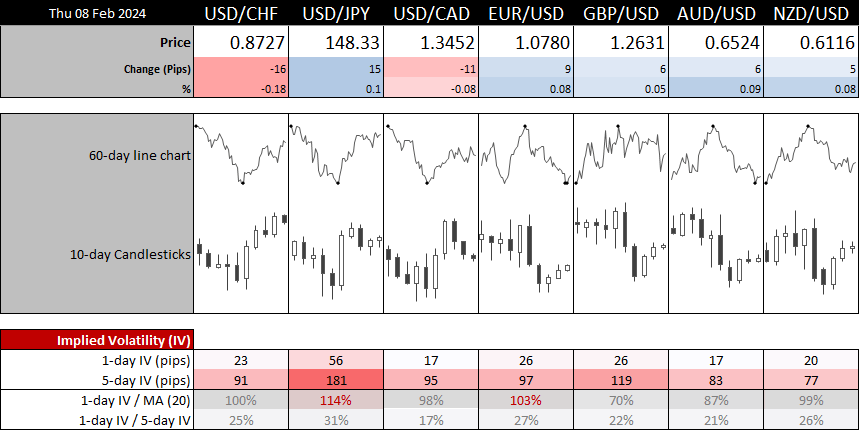
It has been a very quiet session for forex pairs in Asia with major pairs forming very tight ranges. And with no top tier data on the docket for today, we may in in for a quieter session for Europe without a fresh catalyst. 1-day implied volatility levels for FX majors are mostly beneath their 20-day averages. And that means traders may need to opt for lower timeframes to seek opportunities.
Perhaps a freak print in US jobless claims data can shape things up. But even looking at the central bankers set to speak, it is hard to envisage anything dovish being said to the extent of it being exciting.
Looking through the charts, WTI crude and oil stand out as some of the better markets for opportunities for intraday traders.
Events in focus (GMT):
- 13:30 – US jobless claims
- 14:00 – BOE MPC member Dhingra speaks
- 14:15 – ECB member Elderson speaks
- 15:00 – VOE MPC member Mann speaks
- 15:30 – ECB lane speaks
- 17:05 – FOMC member Barkin speaks
Crude oil technical analysis (daily chart):
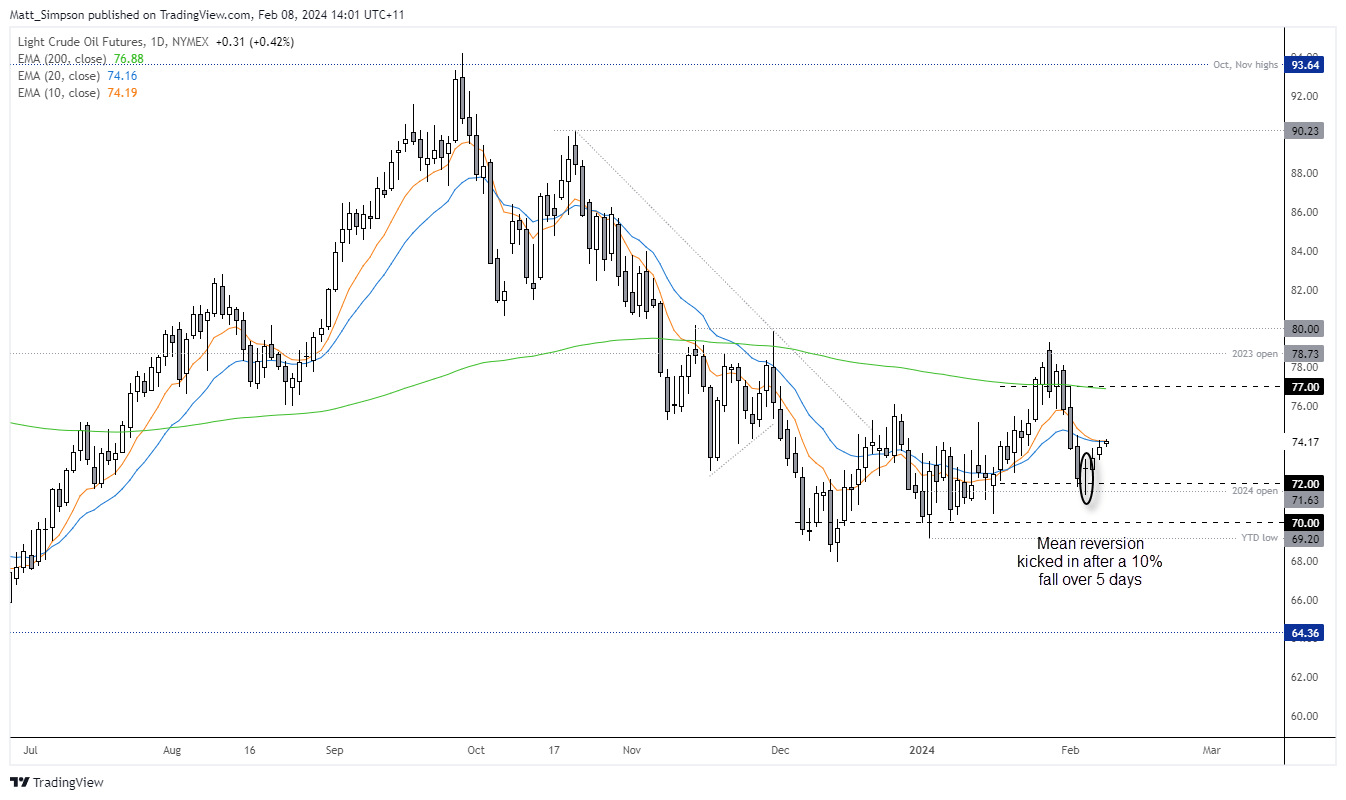
On Monday I noted that crude oil looked stretched at its cycle lows, having already fallen over 10% in five days then formed a doji around the $72 handle and 2024 open price. Whilst we’re yet to see bullish momentum set the world alight, crude oil has at least risen for two consecutive days since that observation and is now trying to tally up a third.
The daily chart shows it has stalled around the 10 and 20-day EMA’s, which could turn out to be a pivotal level for the day.
Crude oil technical analysis (1-hour chart):
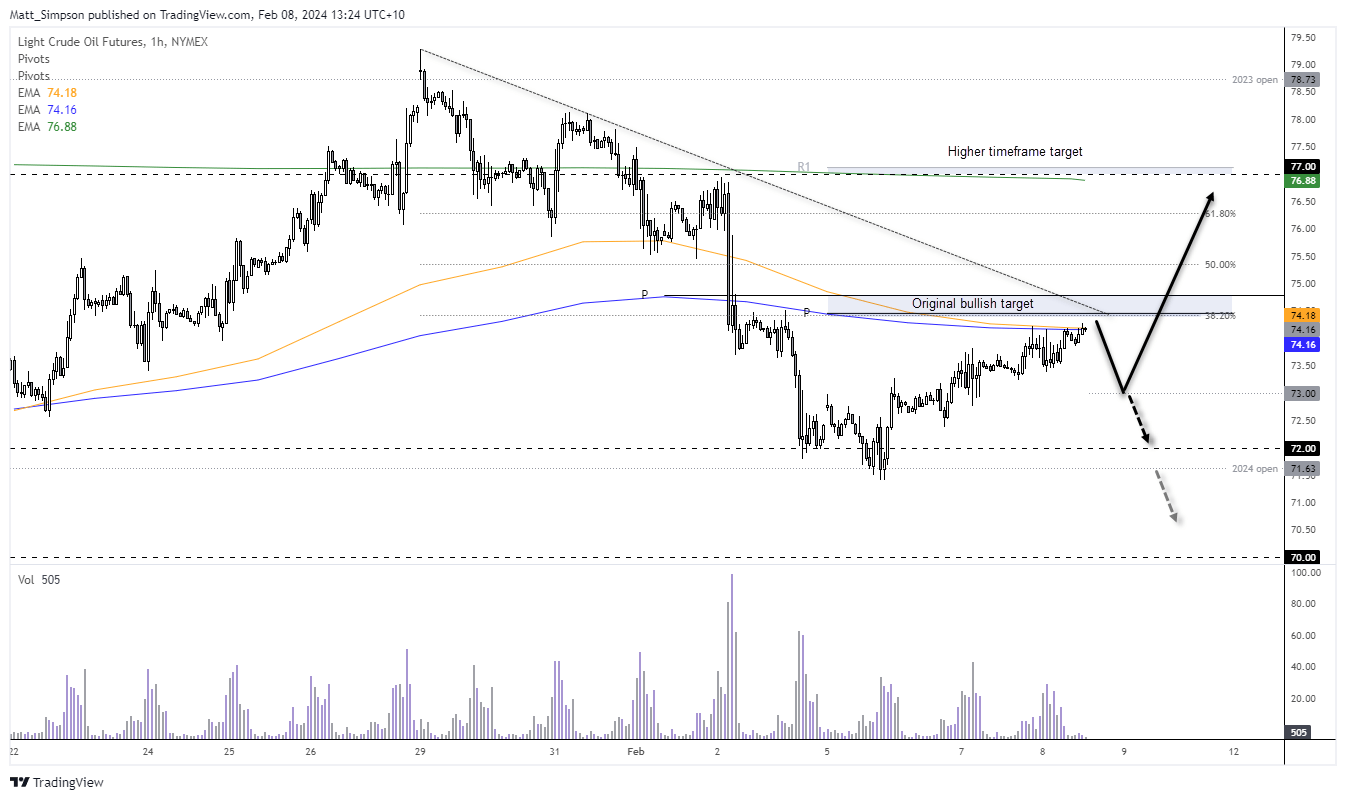
The original bias called for a move to the weekly and monthly pivot points between 74.50 – 74.80. Whilst a move into this zone remail plausible, I’m also conscious of how prices behave around the daily 10 and 20-EMAs. Furthermore, price action on the 1-hour chart is on the choppy side which could either indicate a correction (which assumes a top will form and prices break to new lows), or this is the first move higher of a new trend – in which a pullback may be due before it breaks to new highs.
Ultimately, I am waiting for the market to tip its hand. Note that whilst trading volumes have accompanied swing lows during the rise from $72, each wave has seen diminished volume to suggest bullish interest is waning. I am therefore on the lookout for a move lower, and $73 may make a viable target regardless of whether it is merely a retracement or trend reversal.
Gold technical analysis (1-hour chart):
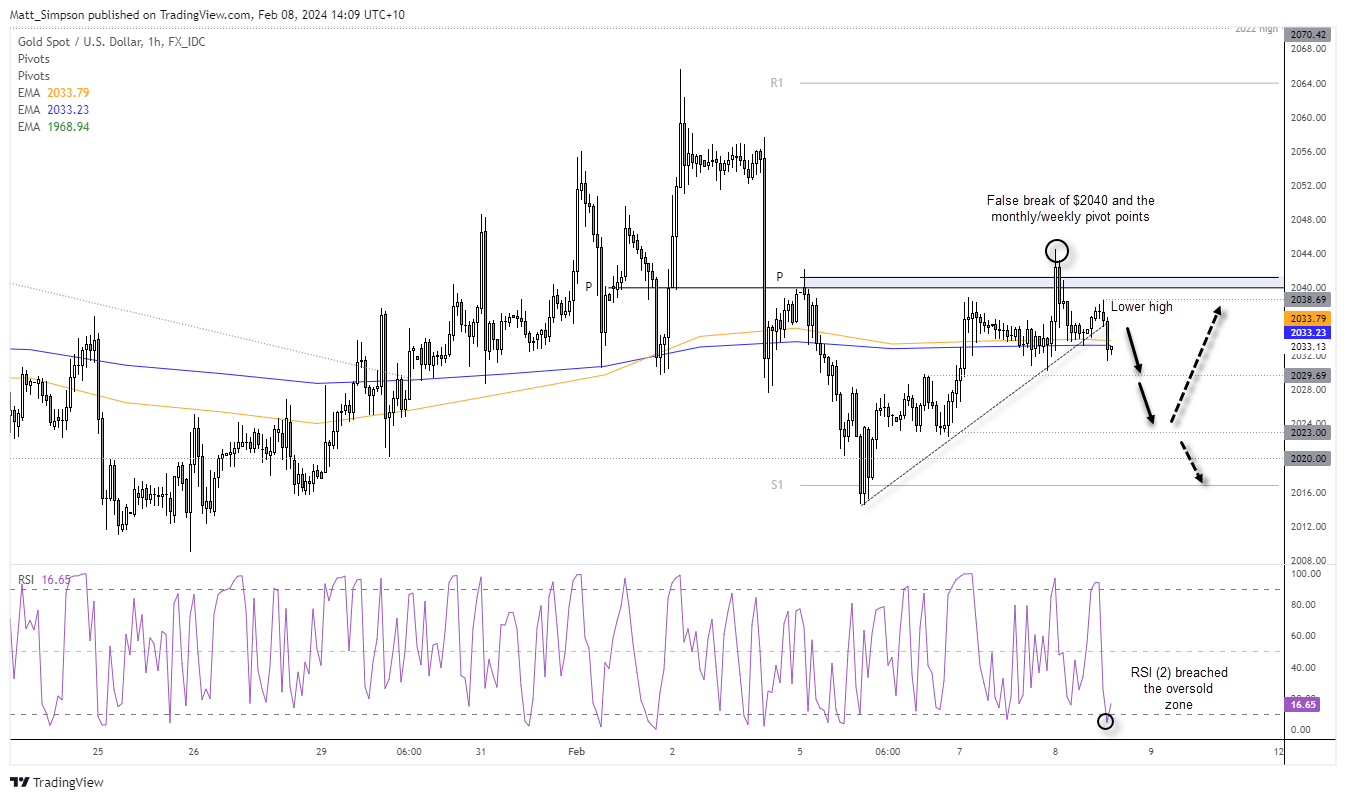
Gold formed a small bearish pinbar on Wednesday, with a false break above $2040 and the weekly and monthly pivot points. And like crude oil, gold is another market which is now drawn towards its 10 and 20-day EMAs. A potential head and shoulders has formed on the 1-hour chart, although in reality such patterns need to form after a trend – which gold does not appear to be in. For now, gold seems to be reacting well to key levels within its own choppy range, but with momentum now pointing lower and having formed a lower high, perhaps its next leg lower is now underway.
Note that RSI (2) is oversold so perhaps a small bounce is due. But bears could seek to fade into minor bounces while prices remain beneath the 2038.69 high.
View the full economic calendar
View the full economic calendar
-- Written by Matt Simpson
Follow Matt on Twitter @cLeverEdge
How to trade with City Index
You can trade with City Index by following these four easy steps:
- Open an account, or log in if you’re already a customer
• Open an account in the UK
• Open an account in Australia
• Open an account in Singapore
- Search for the market you want to trade in our award-winning platform
- Choose your position and size, and your stop and limit levels
- Place the trade
Related tags:



Open an account in minutes
Experience award-winning platforms with fast and secure execution.
Economic calendar
Web Trader platform
Our sophisticated web-based platform is packed with features.
Related articles
China's steel slump leaves iron ore bulls under the pump
Iron ore has broken major support, threatening a return to the lows of 2022 as mounting evidence of weakness in China's steel sector reinforces the bearish outlook.

USD/JPY, AUD/JPY: Central Bank Divergence Creates Two-Way Risk
USD/JPY eyes a breakout above 160, while AUD/JPY faces further losses as Fed, RBA and BoJ interest rate expectations diverge.

Gold and silver forecast: Precious metals extend drop but seasonality hopes keeps bullish case alive
It has been a risk off session so far today with stocks, gold and especially silver (-4%) all taking a drop. Gold has fallen to a fresh 2026 low and its now more than $100 below the psychologically important $4,000 mark. A firmer US dollar, rising US rate expectations and fading safe-haven demand have combined to undermine the metal, despite continued central bank buying. This year has so far been a bad one for gold.

StoneX Financial Ltd (trading as "FOREX.com") is an execution-only service provider. This material, whether or not it states any opinions, is for general information purposes only and it does not take into account your personal circumstances or objectives. This material has been prepared using the thoughts and opinions of the author and these may change. However, FOREX.com does not plan to provide further updates to any material once published and it is not under any obligation to keep this material up to date.
This material is short term in nature and may only relate to facts and circumstances existing at a specific time or day. Nothing in this material is (or should be considered to be) financial, investment, legal, tax or other advice and no reliance should be placed on it. No opinion given in this material constitutes a recommendation by FOREX.com or the author that any particular investment, security, transaction or investment strategy is suitable for any specific person.
The material has not been prepared in accordance with legal requirements designed to promote the independence of investment research. Although FOREX.com is not specifically prevented from dealing before providing this material, FOREX.com does not seek to take advantage of the material prior to its dissemination. This material is not intended for distribution to, or use by, any person in any country or jurisdiction where such distribution or use would be contrary to local law or regulation. For further details see our full non-independent research disclaimer and quarterly summary.