



Crude stocks fall more than expected gold traders await FOMC minutes
The official weekly crude oil inventories report from the US Energy Information Administration (EIA), released this afternoon, has confounded expectations in a positive way and oil prices have correspondingly surged to their best levels since early July. Meanwhile it is a game of wait-and-see as far the dollar is concerned and by extension buck-denominated gold, with traders largely sitting on their hands ahead of the release of the FOMC minutes later on today.
Share this:

The official weekly crude oil inventories report from the US Energy Information Administration (EIA), released this afternoon, has confounded expectations in a positive way and oil prices have correspondingly surged to their best levels since early July.
Whereas the American Petroleum Institute (API) had reported a 1 million barrel decline in US oil stocks and a large 2.2 million barrel build in gasoline inventories last night, today’s EIA data shows that the decrease in crude inventories was in fact more than double that figure at 2.5 million barrels while gasoline inventories actually also fell and by a large amount of 2.7 million barrel. Furthermore, the decline in Cushing stocks were confirmed to be 72,000 barrels.
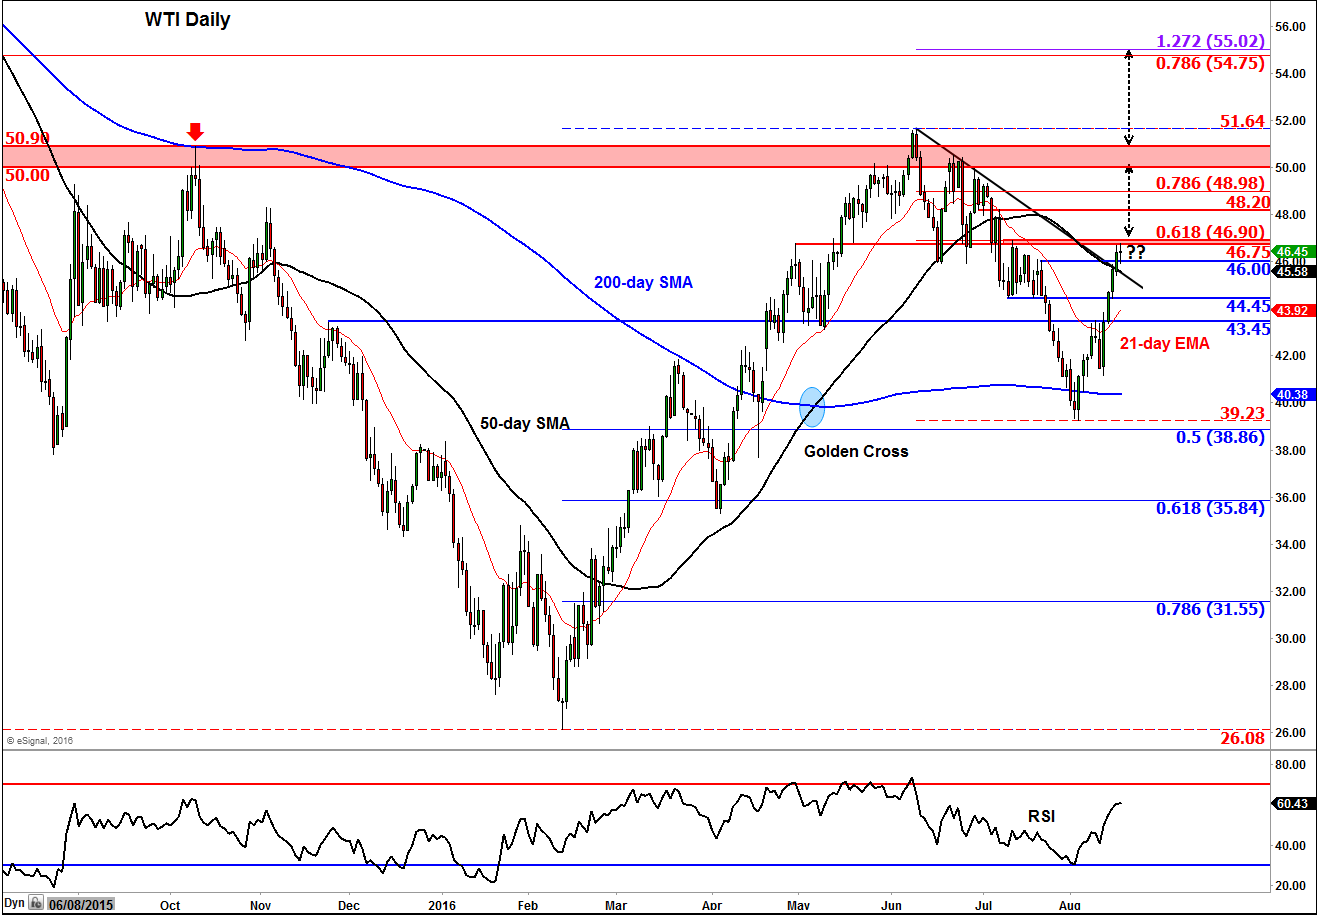
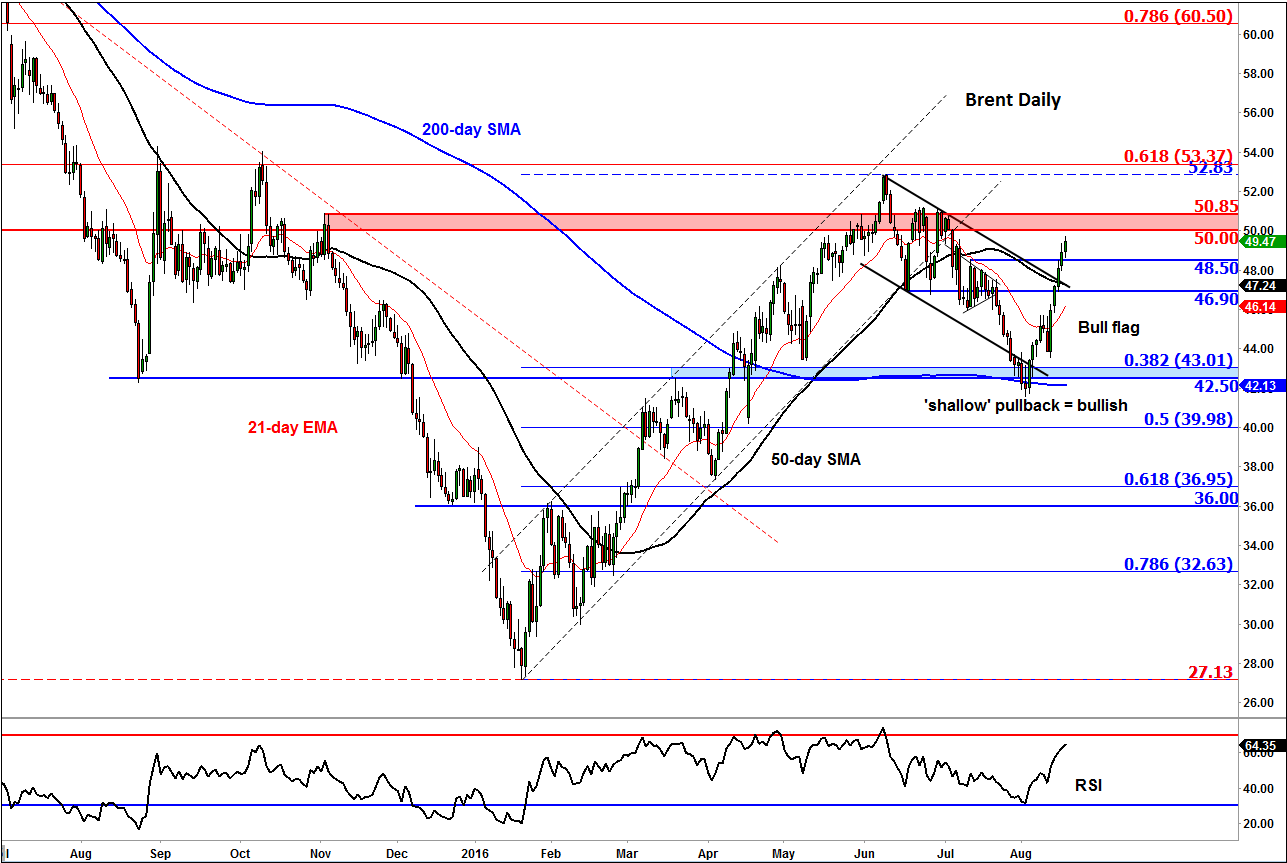
Following the EIA oil report, WTI jumped to a high so far of $46.70 and Brent closed in on $50 and was trading just below this psychological hurdle at the time of this writing.
Saudi Arabia set to increase oil output to new record high
Oil prices have so far shrugged off a report form Reuters that Saudi Arabia is looking to increase its oil output to a new record level in August. If this were to be the case then it would be logical to expect oil prices to find some resistance on concerns over excessive supply. But another way to see it is this: the fact that Saudi Arabia is able to sell so much oil goes to shows that demand is extremely strong. Several oil agencies think that oil market will be at least balanced by mid next year and so there is scope for prices to rise north of $50 again.
I am of the view that oil will be trading in the range between $45 to about $65 in this second half of 2016, but that if it gets nearer to the top of this range then US shale producers will likely respond by pumping more oil once again. That should limit the potential gains. However, it is not as simple as that as there are more variables at work, including, but not limited to, the US dollar, risk sentiment and so on.
A word or two on gold
It is a game of wait-and-see as far the dollar is concerned and by extension buck-denominated gold, with traders largely sitting on their hands ahead of the release of the FOMC minutes later on today. It appears as though bullish traders have shown little interest in buying the perceived safe-haven metal, even though the equity markets have weakened over the past couple of days. So, the metal could drop sharply if stocks now rebound and the Fed minutes convey a hawkish message.
Technical outlook: Brent and WTI
You may recall from my article last Wednesday in which I opined that the long-term outlook on oil was bullish. When I wrote that article, WTI oil was actually falling quite sharply on the day but it was heading into strong support around the $41/$42 area. Taking a closer look on the daily and we can see that WTI formed a large bullish engulfing candle by the very next day. That effectively invalidated the bearish argument, leading to a sharp short-squeeze rally in the ensuing days. Now, oil has reached the prior resistance and 61.8% Fibonacci retracement level against the high from earlier in the year around the $46.75-$46.90 range. While WTI could once again find some resistance here, a potential break above this resistance zone would be deemed a further bullish outcome which could then lead to a push towards the next potential resistance levels at $48.20, $49.00 and then $50.00.
Meanwhile, Brent’s daily chart shows a breakout from its long-term bullish flag pattern, which is obviously bullish if we ignore everything else. The London-based oil contract had recently found strong support from its 200-day moving average which also happened to reside around the 38.2% Fibonacci retracement level and prior support and resistance level of $42.50. Brent had dropped off some 20% from its recent highs to get there, which meant that it was in the official bear territory. However to put thing into perspective, it had gained nearly 95% from this year’s multi-year low to its high of just under $53 at the start of the summer. So a drop of 20% when looked at this way is a shallow pullback. Why am I banging on about this? Well, if Brent oil now goes on to achieve a new high for the year, the relatively shallow pullback would strongly point to a significant continuation higher. But that’s a worry for another day. Brent must first clear its short-term resistance area in the $50.00-$50.85 range.
Source: eSignal and FOREX.com
Source: eSignal and FOREX.com




Open an account in minutes
Experience award-winning platforms with fast and secure execution.
Economic calendar
Web Trader platform
Our sophisticated web-based platform is packed with features.
Related articles

Gold and silver forecast: Precious metals extend drop but seasonality hopes keeps bullish case alive
It has been a risk off session so far today with stocks, gold and especially silver (-4%) all taking a drop. Gold has fallen to a fresh 2026 low and its now more than $100 below the psychologically important $4,000 mark. A firmer US dollar, rising US rate expectations and fading safe-haven demand have combined to undermine the metal, despite continued central bank buying. This year has so far been a bad one for gold.


Nasdaq 100 Forecast: NDX falls ahead of Nvidia’s earnings & Anthropic’s debut this week
U.S. stocks are heading for a weaker open amid a challenging macro backdrop and with AI-linked stocks once again under pressure ahead of Nvidia's results later this week. Attention is also turning to Anthropic's highly anticipated IPO.


Gold, USD/JPY Forecast: Two trades to watch 161126
Gold falls to a yearly low ahead of FOMC minutes this week. USD/JPY hovers around 160 amid a stronger USD and weaker Japanese GDP.
StoneX Financial Ltd (trading as "FOREX.com") is an execution-only service provider. This material, whether or not it states any opinions, is for general information purposes only and it does not take into account your personal circumstances or objectives. This material has been prepared using the thoughts and opinions of the author and these may change. However, FOREX.com does not plan to provide further updates to any material once published and it is not under any obligation to keep this material up to date.
This material is short term in nature and may only relate to facts and circumstances existing at a specific time or day. Nothing in this material is (or should be considered to be) financial, investment, legal, tax or other advice and no reliance should be placed on it. No opinion given in this material constitutes a recommendation by FOREX.com or the author that any particular investment, security, transaction or investment strategy is suitable for any specific person.
The material has not been prepared in accordance with legal requirements designed to promote the independence of investment research. Although FOREX.com is not specifically prevented from dealing before providing this material, FOREX.com does not seek to take advantage of the material prior to its dissemination. This material is not intended for distribution to, or use by, any person in any country or jurisdiction where such distribution or use would be contrary to local law or regulation. For further details see our full non-independent research disclaimer and quarterly summary.