



Fed Manufacturing Indexes not supporting a strong recovery
Will this data continue to fall? It may depend on whether crude oil remains at elevated levels.
Share this:

The Fed Manufacturing Indexes show the level of general business activity each month from around the country. Below are the results for each of the regional Fed Manufacturing Indexes released for May:
Actual Expected Last
NY Empire State -11.6 17 24.6
Philadelphia 2.6 16 17.6
Richmond -9 12 14
Kansas 19 23 28
Dallas (May 31st) ? 0.3 1.1
Many of the firms that participated in the surveys said that supply chain issues and higher costs were still a problem. In the New York region, shipments fell at the fastest pace since early in the pandemic. The Philadelphia Index fell to its lowest level in 2 years.
Next week the US will release the ISM Manufacturing PMI for May. Expectations are for 55.3 vs 55.4 in April. The April reading was the lowest since July 2020. This reading will tell if the trend lower in manufacturing is continuing or if the drop has stalled. Watch for comments regarding supply chain issues and price pressures.
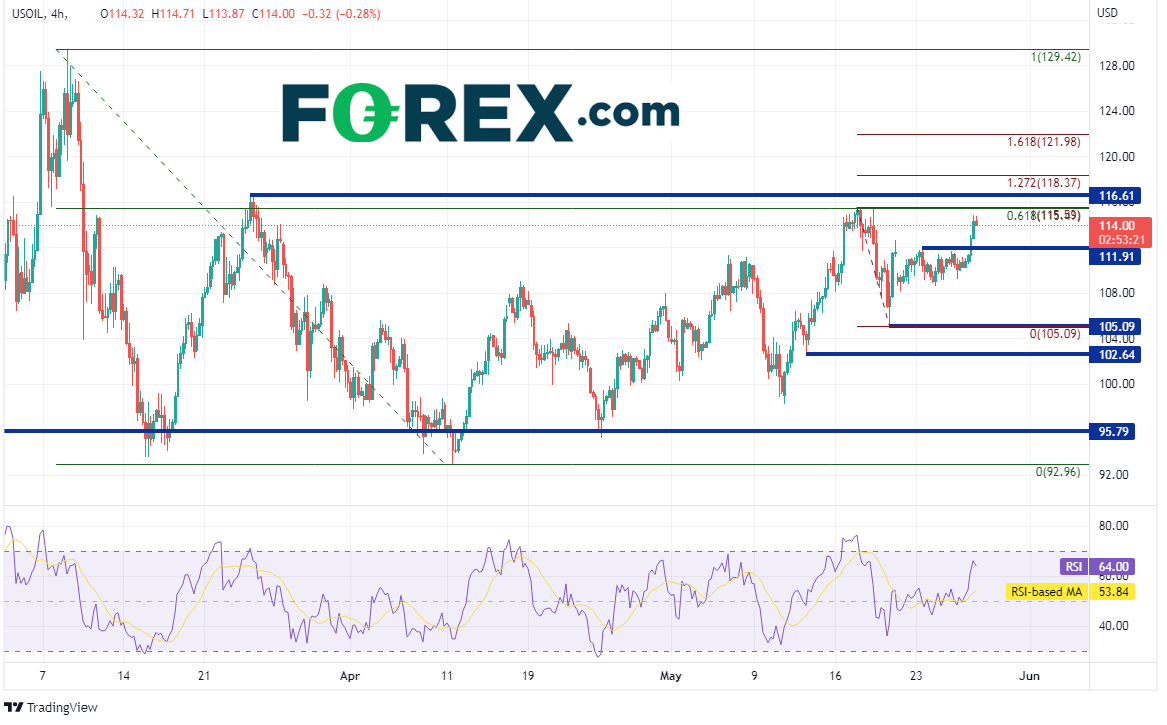
The price of Crude Oil hasn’t helped manufacturers keep their costs low over the last several months. Price had already been elevated in the mid-90s in February when Russia invaded Ukraine. However, it then skyrocketed to 129.42 on March 8th. Crude Oil then pulled back and tested support at the breakout level several times near 95.79. The support level held, and price began moving higher once again. Currently, price is testing recent highs and the 61.8% Fibonacci retracement level from the highs of March 8th to the lows of April 11th, near 115.50.

Source: Tradingview, Stone X
On a 240-minute timeframe, Crude Oil has been trading in a large channel between 92.96 and 116.61 since March 9th. Currently, price is just below a confluence of resistance at the highs of May 17th and the above-mentioned 61.8% Fibonacci retracement level near 115.50. Horizontal resistance crosses slightly higher at 116.61. If price break above there, the next resistance levels are the 127.2% and the 161.8% Fibonacci extensions from the highs of May 17th to the lows of May 19th at 118.37 and 121.98, respectively. Horizontal support is at 111.91, then the May 19th lows at 105.09. Below there, price can fall to the low of May 12th at 102.64.
Source: Tradingview, Stone X
Is manufacturing slowing down growth in the US economy? The recent Fed Manufacturing Indexes seem to be pointing in that direction. Will this data continue to fall? It may depend on whether crude oil remains at elevated levels, or even moves higher!
The Fed Manufacturing Indexes show the level of general business activity each month from around the country. Below are the results for each of the regional Fed Manufacturing Indexes released for May:
Actual Expected Last
NY Empire State -11.6 17 24.6
Philadelphia 2.6 16 17.6
Richmond -9 12 14
Kansas 19 23 28
Dallas (May 31st) ? 0.3 1.1
Many of the firms that participated in the surveys said that supply chain issues and higher costs were still a problem. In the New York region, shipments fell at the fastest pace since early in the pandemic. The Philadelphia Index fell to its lowest level in 2 years.
Next week the US will release the ISM Manufacturing PMI for May. Expectations are for 55.3 vs 55.4 in April. The April reading was the lowest since July 2020. This reading will tell if the trend lower in manufacturing is continuing or if the drop has stalled. Watch for comments regarding supply chain issues and price pressures.
The price of Crude Oil hasn’t helped manufacturers keep their costs low over the last several months. Price had already been elevated in the mid-90s in February when Russia invaded Ukraine. However, it then skyrocketed to 129.42 on March 8th. Crude Oil then pulled back and tested support at the breakout level several times near 95.79. The support level held, and price began moving higher once again. Currently, price is testing recent highs and the 61.8% Fibonacci retracement level from the highs of March 8th to the lows of April 11th, near 115.50.

Source: Tradingview, Stone X
Trade Crude Oil now: Login or Open a new account!
• Open an account in the UK
• Open an account in Australia
• Open an account in Singapore
On a 240-minute timeframe, Crude Oil has been trading in a large channel between 92.96 and 116.61 since March 9th. Currently, price is just below a confluence of resistance at the highs of May 17th and the above-mentioned 61.8% Fibonacci retracement level near 115.50. Horizontal resistance crosses slightly higher at 116.61. If price break above there, the next resistance levels are the 127.2% and the 161.8% Fibonacci extensions from the highs of May 17th to the lows of May 19th at 118.37 and 121.98, respectively. Horizontal support is at 111.91, then the May 19th lows at 105.09. Below there, price can fall to the low of May 12th at 102.64.

Source: Tradingview, Stone X
Is manufacturing slowing down growth in the US economy? The recent Fed Manufacturing Indexes seem to be pointing in that direction. Will this data continue to fall? It may depend on whether crude oil remains at elevated levels, or even moves higher!
Learn more about oil trading opportunities.
Related tags:


Open an account in minutes
Experience award-winning platforms with fast and secure execution.
Economic calendar
Web Trader platform
Our sophisticated web-based platform is packed with features.
Related articles

US dollar rally loses yield support as Nvidia looms
US yields are retreating, but the dollar isn't following. With risk aversion potentially keeping it supported, Nvidia's results could determine whether emerging reversal signals in AUD/USD and EUR/USD develop further.

GBP/USD, GBP/JPY, GBP/AUD: Sterling Eyes UK Inflation Catalyst
Sterling faces a pivotal UK inflation test as traders weigh BoE tightening, Fed minutes and Australian employment data across GBP/USD, GBP/JPY and GBP/AUD.


EUR/USD outlook: euro back above 1.1000 as dollar rally loses steam
EUR/USD has recovered back above 1.1000 after a brief break lower, a sign the dollar's inflation-driven rally may be losing momentum. With a December Fed hike largely priced in and oil a potential tailwind for the euro, the risks are starting to tilt to the upside.

StoneX Financial Ltd (trading as "FOREX.com") is an execution-only service provider. This material, whether or not it states any opinions, is for general information purposes only and it does not take into account your personal circumstances or objectives. This material has been prepared using the thoughts and opinions of the author and these may change. However, FOREX.com does not plan to provide further updates to any material once published and it is not under any obligation to keep this material up to date.
This material is short term in nature and may only relate to facts and circumstances existing at a specific time or day. Nothing in this material is (or should be considered to be) financial, investment, legal, tax or other advice and no reliance should be placed on it. No opinion given in this material constitutes a recommendation by FOREX.com or the author that any particular investment, security, transaction or investment strategy is suitable for any specific person.
The material has not been prepared in accordance with legal requirements designed to promote the independence of investment research. Although FOREX.com is not specifically prevented from dealing before providing this material, FOREX.com does not seek to take advantage of the material prior to its dissemination. This material is not intended for distribution to, or use by, any person in any country or jurisdiction where such distribution or use would be contrary to local law or regulation. For further details see our full non-independent research disclaimer and quarterly summary.