

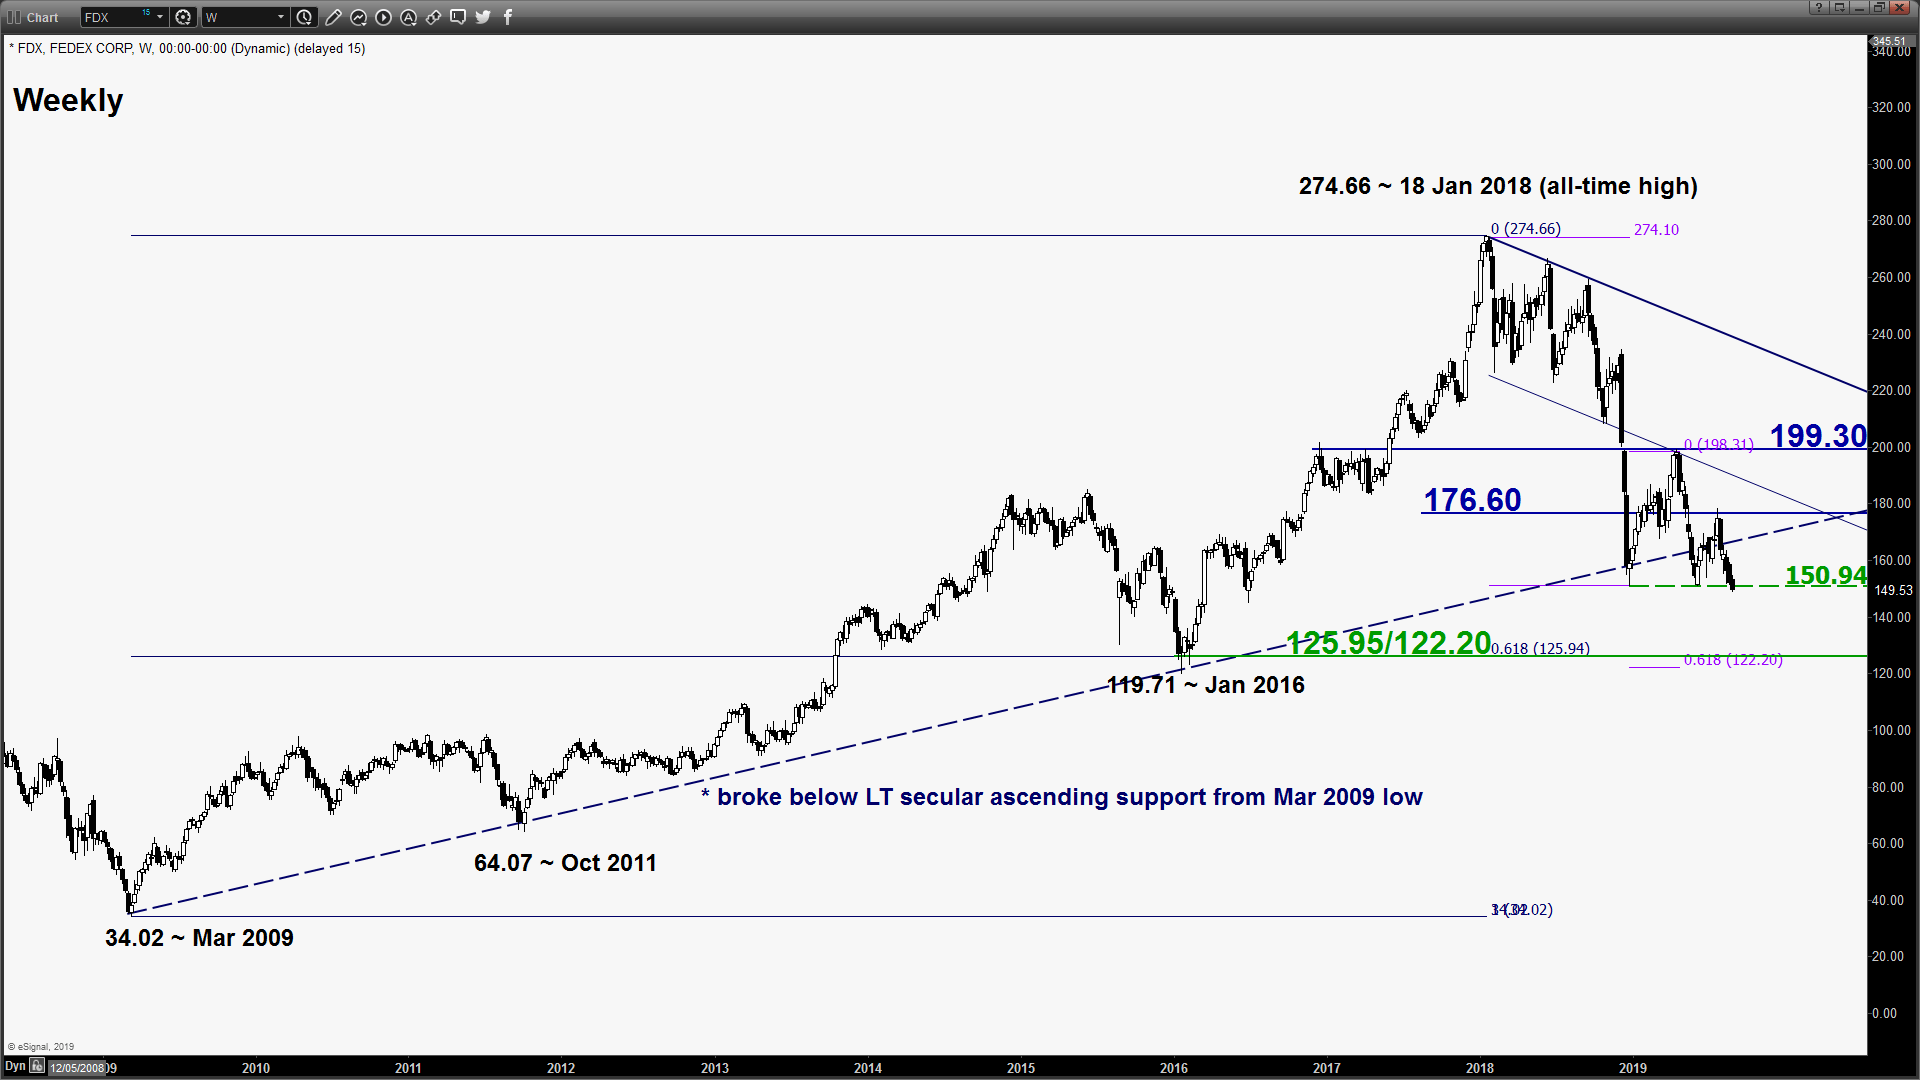



FedEX broke below 52 week low further potential downside ahead
FedEX secular uptrend since Mar 2009 has been damaged.
Share this:

FedEX Corp (FDX)
click to enlarge charts
Key Levels (1 to 3 weeks)
Intermediate resistance: 158.80
Pivot (key resistance): 176.60
Supports: 132.40 & 125.95/122.20
Next resistance: 199.30
Directional Bias (1 to 3 weeks)
FedEx has staged a bearish breakdown yesterday, 27 Aug below the 26 Dec 2018 low and its 52-week low of 150.68. It has recorded a daily close of 149.53 at end of yesterday U.S. session.
Bearish bias below 176.60 key medium-term pivotal resistance for further potential impulsive downleg sequence to target the next supports at 132.40 and 129.95/122.20 zone. However, a clearance with a daily close above 176.60 invalidates the bearish scenario for a squeeze up towards the major range resistance of 199.30.
Key elements
- After 2-weeks whipsaw in price action seen in early to mid-Jul 2019 above the long-term secular ascending support from Mar 2009 low, FDX has reintegrated below the ascending support and stays below it for the past 4-weeks.
- Since 18 Apr 2018 high, FDX has evolved into a medium-term descending channel with the upper limit acting as a resistance at 176.60.
- The daily RSI oscillator remains negative below the a corresponding resistance at the 45 level which suggests medium-term downside momentum of price action remains intact.
- The next significant medium-term support rests at the 125.95/122.20 zone which is defined by the major swing low of Jan 2016, the lower boundary of the medium-term descending channel and a Fibonacci retracement/projection cluster.
- Relative strength analysis against the market (S&P 500) and its sector (Industrials) are suggesting further potential underperformance of FDX.
Charts are from eSignal
FedEX Corp (FDX)
click to enlarge charts
Key Levels (1 to 3 weeks)
Intermediate resistance: 158.80
Pivot (key resistance): 176.60
Supports: 132.40 & 125.95/122.20
Next resistance: 199.30
Directional Bias (1 to 3 weeks)
FedEx has staged a bearish breakdown yesterday, 27 Aug below the 26 Dec 2018 low and its 52-week low of 150.68. It has recorded a daily close of 149.53 at end of yesterday U.S. session.
Bearish bias below 176.60 key medium-term pivotal resistance for further potential impulsive downleg sequence to target the next supports at 132.40 and 129.95/122.20 zone. However, a clearance with a daily close above 176.60 invalidates the bearish scenario for a squeeze up towards the major range resistance of 199.30.
Key elements
- After 2-weeks whipsaw in price action seen in early to mid-Jul 2019 above the long-term secular ascending support from Mar 2009 low, FDX has reintegrated below the ascending support and stays below it for the past 4-weeks.
- Since 18 Apr 2018 high, FDX has evolved into a medium-term descending channel with the upper limit acting as a resistance at 176.60.
- The daily RSI oscillator remains negative below the a corresponding resistance at the 45 level which suggests medium-term downside momentum of price action remains intact.
- The next significant medium-term support rests at the 125.95/122.20 zone which is defined by the major swing low of Jan 2016, the lower boundary of the medium-term descending channel and a Fibonacci retracement/projection cluster.
- Relative strength analysis against the market (S&P 500) and its sector (Industrials) are suggesting further potential underperformance of FDX.
Charts are from eSignal
Related tags:
Latest market news




Open an account in minutes
Experience award-winning platforms with fast and secure execution.
Economic calendar
Web Trader platform
Our sophisticated web-based platform is packed with features.
Related articles

Bitcoin Bulls Eye Weekend Bounce as Nasdaq Finds Support
Bitcoin bulls eye a weekend bounce as Nasdaq finds support, BTC holds $80k and bullish reversal signals emerge alongside stronger correlations.


Iron ore bulls face a perfect storm as price tests major support
Deteriorating steelmaker profitability, seasonal weakness and bearish technicals are weighing on iron ore. But with the price testing critical support, there's genuine two-way directional risk despite the substantial headwinds facing bulls.

Dow Leads Wall Street Lower on Inflation Fears, Nasdaq Defies Weak Breadth
Dow futures lead Wall Street lower as oil, yields and inflation fears rise, while Nasdaq resilience masks weakening market breadth.
StoneX Financial Ltd (trading as "FOREX.com") is an execution-only service provider. This material, whether or not it states any opinions, is for general information purposes only and it does not take into account your personal circumstances or objectives. This material has been prepared using the thoughts and opinions of the author and these may change. However, FOREX.com does not plan to provide further updates to any material once published and it is not under any obligation to keep this material up to date.
This material is short term in nature and may only relate to facts and circumstances existing at a specific time or day. Nothing in this material is (or should be considered to be) financial, investment, legal, tax or other advice and no reliance should be placed on it. No opinion given in this material constitutes a recommendation by FOREX.com or the author that any particular investment, security, transaction or investment strategy is suitable for any specific person.
The material has not been prepared in accordance with legal requirements designed to promote the independence of investment research. Although FOREX.com is not specifically prevented from dealing before providing this material, FOREX.com does not seek to take advantage of the material prior to its dissemination. This material is not intended for distribution to, or use by, any person in any country or jurisdiction where such distribution or use would be contrary to local law or regulation. For further details see our full non-independent research disclaimer and quarterly summary.