



Frightening start as crude oil slumps
<p>This may be a dreaded month for the equity market investors and so far it is proving that way due to some really disappointing corporate earnings results, but crude oil is having an equally frightening start too. Both oil contracts have fallen sharply in the first two days of May with WTI finding itself back to $44 and Brent around $45 a barrel. In truth, the sell-off should not have come as a major surprise to anyone as net long positions had been rising to record levels in recent weeks. It is likely that those positions have now been reduced amid profit-taking as oil prices approached the lower band of levels many think will put the brakes on the decline in US oil production, namely around $50-$70 a barrel. Oil prices have also been absorbing a lot of negative news lately and completely ignoring the fact the markets remain oversupplied with US crude oil inventories being at and record-high levels. So, the pressure for a squeeze was building anyway. Iran is continuing to increase oil output following an end to its sanctions in January; Saudi Arabia, unwilling to lose market share to Iran, produces near record levels and Iraqi oil production is at 30-year highs.</p>
Share this:

This may be a dreaded month for the equity market investors and so far it is proving that way due to some really disappointing corporate earnings results, but crude oil is having an equally frightening start too. Both oil contracts have fallen sharply in the first two days of May with WTI finding itself back to $44 and Brent around $45 a barrel. In truth, the sell-off should not have come as a major surprise to anyone as net long positions had been rising to record levels in recent weeks. It is likely that those positions have now been reduced amid profit-taking as oil prices approached the lower band of levels many think will put the brakes on the decline in US oil production, namely around $50-$70 a barrel. Oil prices have also been absorbing a lot of negative news lately and completely ignoring the fact the markets remain oversupplied with US crude oil inventories being at and record-high levels. So, the pressure for a squeeze was building anyway. Iran is continuing to increase oil output following an end to its sanctions in January; Saudi Arabia, unwilling to lose market share to Iran, produces near record levels and Iraqi oil production is at 30-year highs.
This week’s focus will be on the US dollar due to the sheer number of top tier data scheduled for publication over the coming days. In addition, the weekly oil supply data should help to provide some direction to oil prices. Thus, things could change very quickly as we move into the second half of the week.
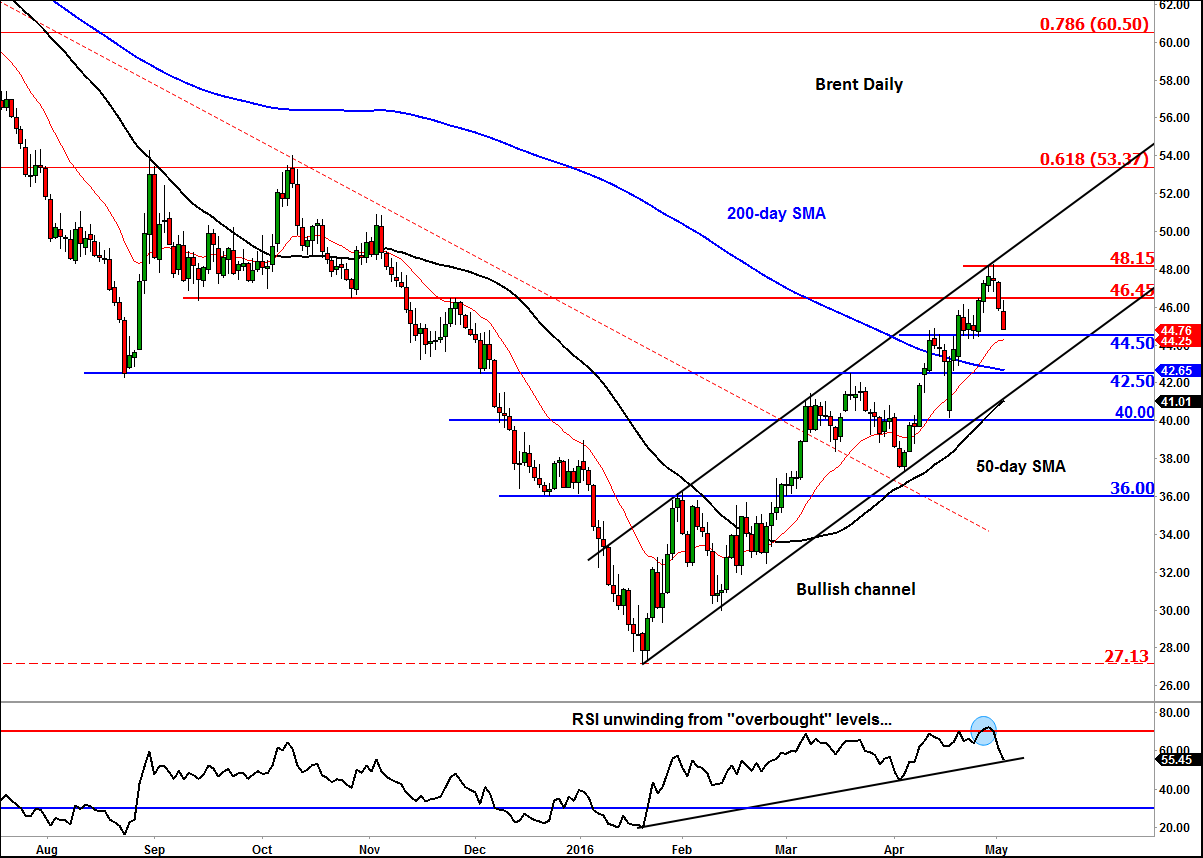
Meanwhile from a technical perspective, oil’s sell-off is hardly surprising, for after all, Brent had reached the top of its bullish channel around $48.50 last week at the same time as the momentum indictor RSI had reached its own "overbought" levels of >70. The RSI has now began to unwind from these overbought levels, potentially increasingly the odds we will see another upsurge in oil prices soon. Indeed, the underlying trend still appears to be bullish for oil despite the slump at the start of this week. So far, the trend of higher highs and higher lows have not been violated and price is rising inside a bullish channel. What’s more, all the main moving averages reside below price, with the 50-day simple moving average and the 21-day exponential overage both pointing higher. So, this could just be a pause in the upward trend rather than the start of a major downward move.
While the medium-term bullish trend may still be intact, in the short term Brent oil could drop further before it potentially resumes its rally. In fact, the short-term support at around $46.45 has already broken down, and there are not many prior reference points to watch until $44.50. More significant support areas are around (1) $42.50-60 where previous support/resistance meets the 200-day moving average, followed by (2) $41.00-50, a level which corresponds with the support trend of the bullish channel. A potential break below the latter would signal the end of the current bullish trend.
So, in the short-term there is the potential for some further weakness in what still is a rising trend overall.
Related tags:


Open an account in minutes
Experience award-winning platforms with fast and secure execution.
Economic calendar
Web Trader platform
Our sophisticated web-based platform is packed with features.
Related articles
China's steel slump leaves iron ore bulls under the pump
Iron ore has broken major support, threatening a return to the lows of 2022 as mounting evidence of weakness in China's steel sector reinforces the bearish outlook.

NZD/USD Forecast: Kiwi faces historic breakdown as RBNZ survey looms
NZD/USD is teetering above support that held through the pandemic and Liberation Day turmoil. With RBNZ hawks repeatedly disappointed, today's inflation expectations survey could open the door to a slide towards the GFC lows.

DXY, GBP/USD, AUD/USD, USD/CAD, USD/JPY, Gold Weekly Technical Outlook 11 16 2026
Sr. Technical Strategist Michael Boutros highlights the levels that matter on the USD Majors, commodities, and equity indices charts this week.

StoneX Financial Ltd (trading as "FOREX.com") is an execution-only service provider. This material, whether or not it states any opinions, is for general information purposes only and it does not take into account your personal circumstances or objectives. This material has been prepared using the thoughts and opinions of the author and these may change. However, FOREX.com does not plan to provide further updates to any material once published and it is not under any obligation to keep this material up to date.
This material is short term in nature and may only relate to facts and circumstances existing at a specific time or day. Nothing in this material is (or should be considered to be) financial, investment, legal, tax or other advice and no reliance should be placed on it. No opinion given in this material constitutes a recommendation by FOREX.com or the author that any particular investment, security, transaction or investment strategy is suitable for any specific person.
The material has not been prepared in accordance with legal requirements designed to promote the independence of investment research. Although FOREX.com is not specifically prevented from dealing before providing this material, FOREX.com does not seek to take advantage of the material prior to its dissemination. This material is not intended for distribution to, or use by, any person in any country or jurisdiction where such distribution or use would be contrary to local law or regulation. For further details see our full non-independent research disclaimer and quarterly summary.