



Gold weekly outlook and key levels | February 23, 2026
Gold appears to have benefitted the most from renewed US dollar weakness and lingering trade uncertainty following the Supreme Court ruling on Trump’s tariffs on Friday. Investors worried that the news could put fresh stress on government finances, although stocks managed to bounce into the close. Still, that macro backdrop has kept gold outlook positive, with the metal wrapping up its third consecutive weekly gain on Friday.
Share this:

Gold appears to have benefitted the most from renewed US dollar weakness and lingering trade uncertainty following the Supreme Court ruling on Trump’s tariffs on Friday. Investors worried that the news could put fresh stress on government finances, although stocks managed to bounce into the close. Still, that macro backdrop has kept gold outlook positive, with the metal wrapping up its third consecutive weekly gain on Friday.
Weekly gold chart looks bullish
Gold closed comfortably above the $5,000 mark on Friday. What really stands out to me is the bullish hammer-like candle on the weekly chart. That’s not the kind of structure you see in a market that’s ready to roll over. If anything, it tells me buyers are still in control of price action despite that big drop we saw at the end of January.
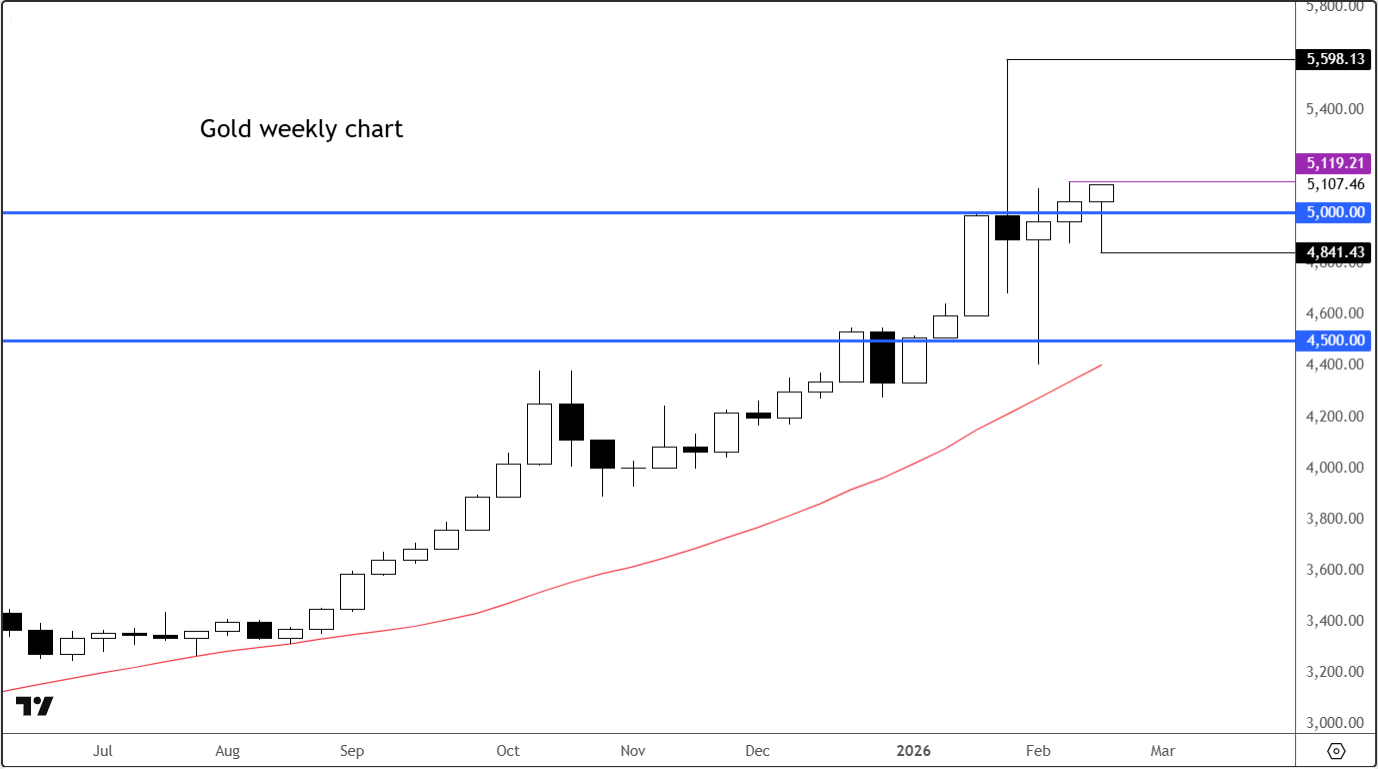
Right now, the path of least resistance looks higher. As long as price continues to hold above $5,000, I’m not interested in fading this move. The short side simply doesn’t make sense unless the charts start to deteriorate — and we’re not there yet.
Key XAU/USD short term levels to watch
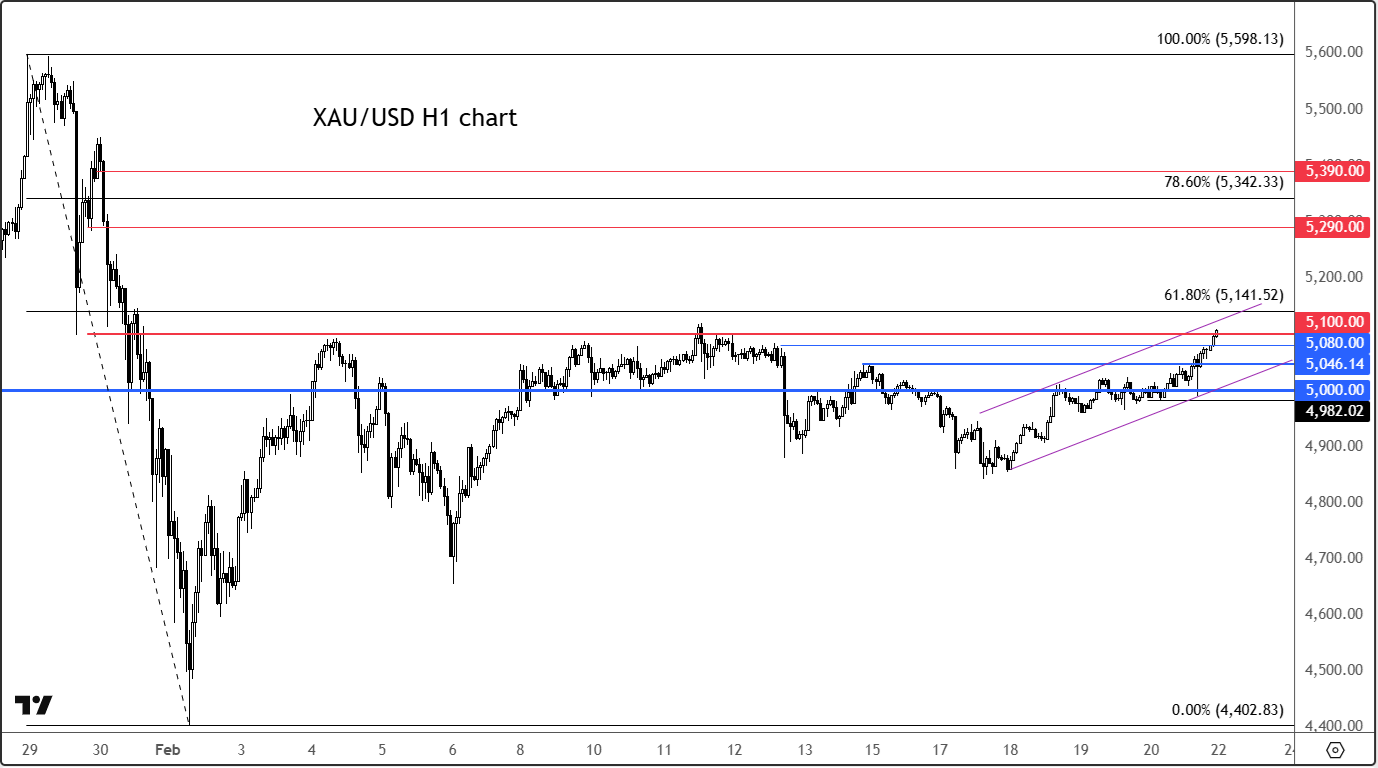
The breakout above $5,100 is also significant. That level capped price back on February 11th, and now we’ve closed a Friday session above it, which is constructive. When prior resistance levels give way and hold into the weekly close, it often signals that momentum is building rather than fading.
From here, the next upside level I’m watching is $5,290 — a former intraday support zone that collapsed during the sharp sell-off at the end of January.
Beyond that, $5,390 comes into focus. That’s another technically interesting area and one that could act as the next major upside magnet if momentum continues.
Meanwhile, it is also worth keeping an eye on the Fibonacci retracement levels from the late-January drop, which also line up nicely with the above levels. The 61.8% retracement sits around $5,141, while the 78.6% level comes in near $5,342.
Downside scenario for gold outlook
Now, let’s talk risk.
The $5,000 level is absolutely critical. It’s psychological, it’s technical, and it’s now the pivot that defines the short-term trend. If we slip back below it, the tone changes quickly. Even more important is Friday’s low at $4,982. That’s my line in the sand. A clean break below that level would likely trigger a deeper pullback and potentially unwind this latest leg higher.
Before we even get there, though, there are a few near-term supports to watch. The $5,046 area — prior resistance — could now flip into support. There’s also support around $5,080, which has attracted buying interest on a shorter-term basis.


In summary
For now, the structure remains constructive for the gold outlook in as far as the near term is concerned. Unless price action proves otherwise, dip buying look the trade that still pays, and momentum still favours the upside heading into the week ahead.
Source for all charts used in this article: TradingView.com
-- Written by Fawad Razaqzada, Market Analyst
Follow Fawad on Twitter @Trader_F_R
How to trade with City Index
You can trade with City Index by following these four easy steps:
- Open an account, or log in if you’re already a customer
• Open an account in the UK
• Open an account in Australia
• Open an account in Singapore
- Search for the company you want to trade in our award-winning platform
- Choose your position and size, and your stop and limit levels
- Place the trade
Related tags:
Latest market news




Open an account in minutes
Experience award-winning platforms with fast and secure execution.
Economic calendar
Web Trader platform
Our sophisticated web-based platform is packed with features.
Related articles
S&P 500 forecast: Why US stocks have largely defied gravity and what could trigger a correction
Though we have seen some weakness in US stock markets recently, this has been nothing compared to the percentage drops we have seen this year for Bitcoin, silver and several major Asia pacific equity markets. The divergence raises an important question: is S&P 500 genuinely insulated from the forces weighing on other assets, or is it simply taking longer for the weakness to spread?
US Dollar, Gold, Silver Outlook: 2026 Extremes and Key Levels to Watch
US Dollar, Gold, Silver Outlook: Major currency pairs and precious metals are testing 2026 extremes as markets price in a 25-basis-point Fed rate hike in December. However, stretched momentum indicators are bringing near-term reversal risks into focus.


China's steel slump leaves iron ore bulls under the pump
Iron ore has broken major support, threatening a return to the lows of 2022 as mounting evidence of weakness in China's steel sector reinforces the bearish outlook.

StoneX Financial Ltd (trading as "FOREX.com") is an execution-only service provider. This material, whether or not it states any opinions, is for general information purposes only and it does not take into account your personal circumstances or objectives. This material has been prepared using the thoughts and opinions of the author and these may change. However, FOREX.com does not plan to provide further updates to any material once published and it is not under any obligation to keep this material up to date.
This material is short term in nature and may only relate to facts and circumstances existing at a specific time or day. Nothing in this material is (or should be considered to be) financial, investment, legal, tax or other advice and no reliance should be placed on it. No opinion given in this material constitutes a recommendation by FOREX.com or the author that any particular investment, security, transaction or investment strategy is suitable for any specific person.
The material has not been prepared in accordance with legal requirements designed to promote the independence of investment research. Although FOREX.com is not specifically prevented from dealing before providing this material, FOREX.com does not seek to take advantage of the material prior to its dissemination. This material is not intended for distribution to, or use by, any person in any country or jurisdiction where such distribution or use would be contrary to local law or regulation. For further details see our full non-independent research disclaimer and quarterly summary.