



US Dollar, Gold, Silver Outlook: 2026 Extremes and Key Levels to Watch
US Dollar, Gold, Silver Outlook: Major currency pairs and precious metals are testing 2026 extremes as markets price in a 25-basis-point Fed rate hike in December. However, stretched momentum indicators are bringing near-term reversal risks into focus.
Share this:

EUR/USD and GBP/USD, along with Gold and Silver, are testing key 2026 extremes as expectations for a December rate hike continue to support the U.S. dollar and US Treasury Yields. Higher-than-expected inflation and persistent geopolitical escalations—including escalating cyberattacks—are keeping a risk premium in crude oil and reinforcing a hawkish central bank outlook.
Markets have largely priced in a December rate hike. According to the CME Fed Watch tool, the probability of a 25-basis-point hike is around 95%, with roughly a 5% chance of a 50-basis-point hike and almost no expectation of a rate hold. The dollar has climbed to new 2026 highs near 103.50, testing a nine-month resistance and weekly overbought momentum levels last seen in 2025.
December Rate-Hike Expectations
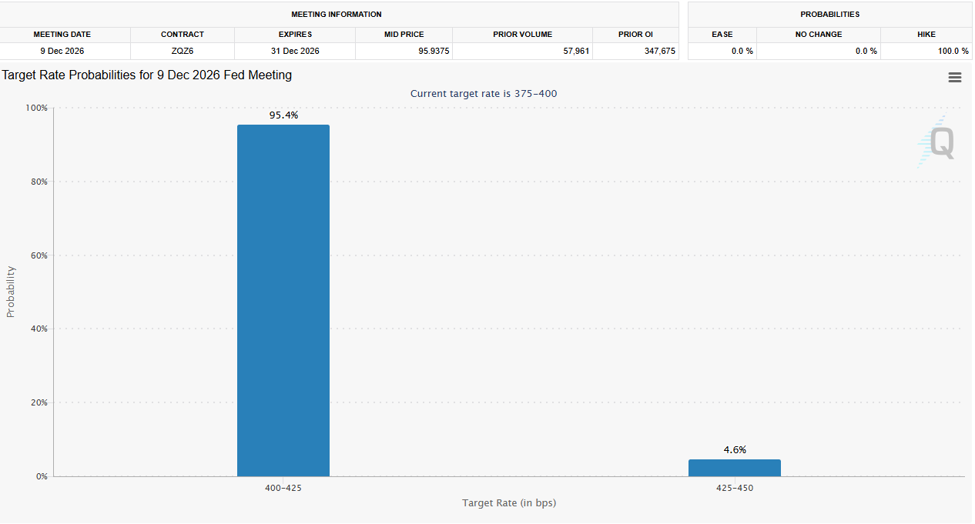
Source: CME FedWatch Tool
When markets aggressively price in a rate hike and momentum indicators reach extremes, caution is warranted. Weekly RSI readings are approaching historical levels across the dollar, euro, gold and silver, with some of these conditions last seen in 2022 and 2023. Together, they raise the possibility of reversals across the charts.
I cover the key setups, catalysts and levels I’m watching across FX, commodities, indices and NVDA in my latest video.
This content was created by an affiliate of FOREX.com and represents the views and opinions of the author/speakers, not the views and opinions of Forex.com, StoneX Group Inc., or its subsidiaries. The content has not been independently reviewed by Forex.com.
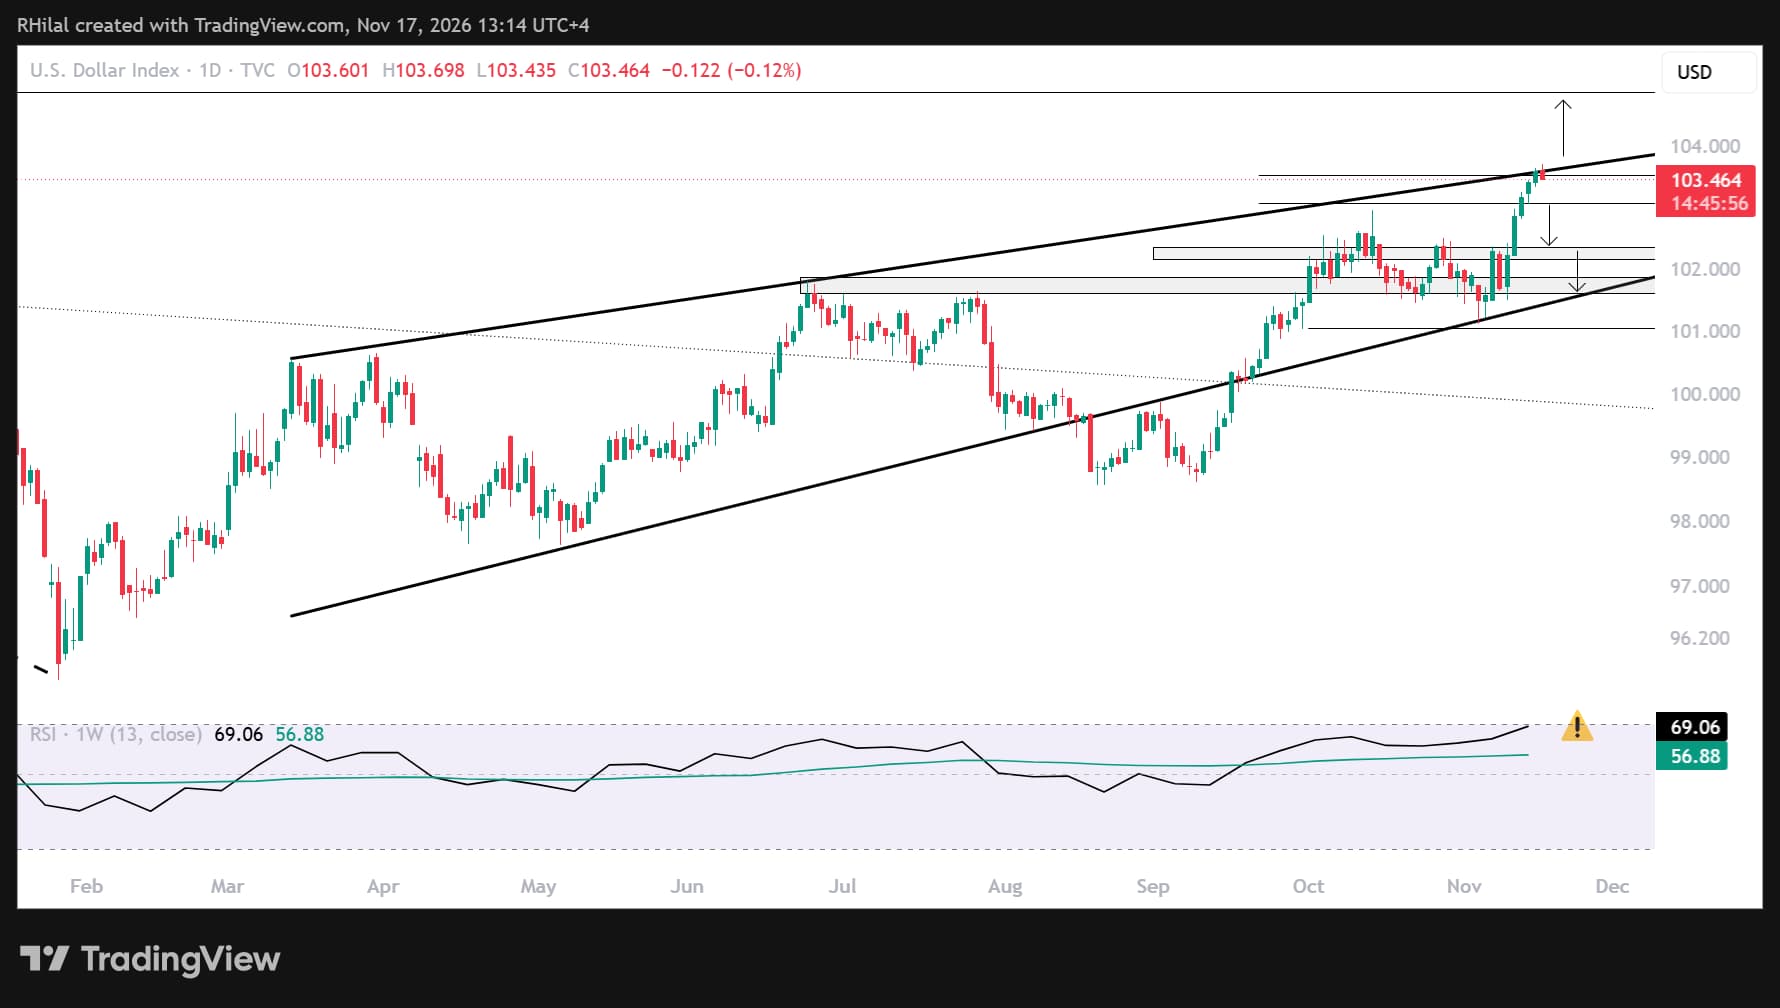
U.S. Dollar Index Outlook: Daily Time Frame – Log Scale
Source: Trading View
Indicators used: Weekly RSI, trendlines, Fibonacci retracement and extension tools
The DXY is testing a key confluence zone where reversal risks may be building. Price action is approaching:
- Nine-month rising resistance connecting higher highs since March 2026
- The 61.8% Fibonacci extension of the wave spanning the September, October and November extremes
- Weekly overbought RSI levels last seen in January 2025
- Weekly oversold RSI levels on the EUR/USD chart last seen in 2022
Given these stretched conditions, a sustained close above 103.50 would confirm longer-term bullish continuation risks, potentially adding further pressure on currency markets and precious metals. A breakdown below 103, 102.60 and 101.60 would bring the bearish outlook back into focus.
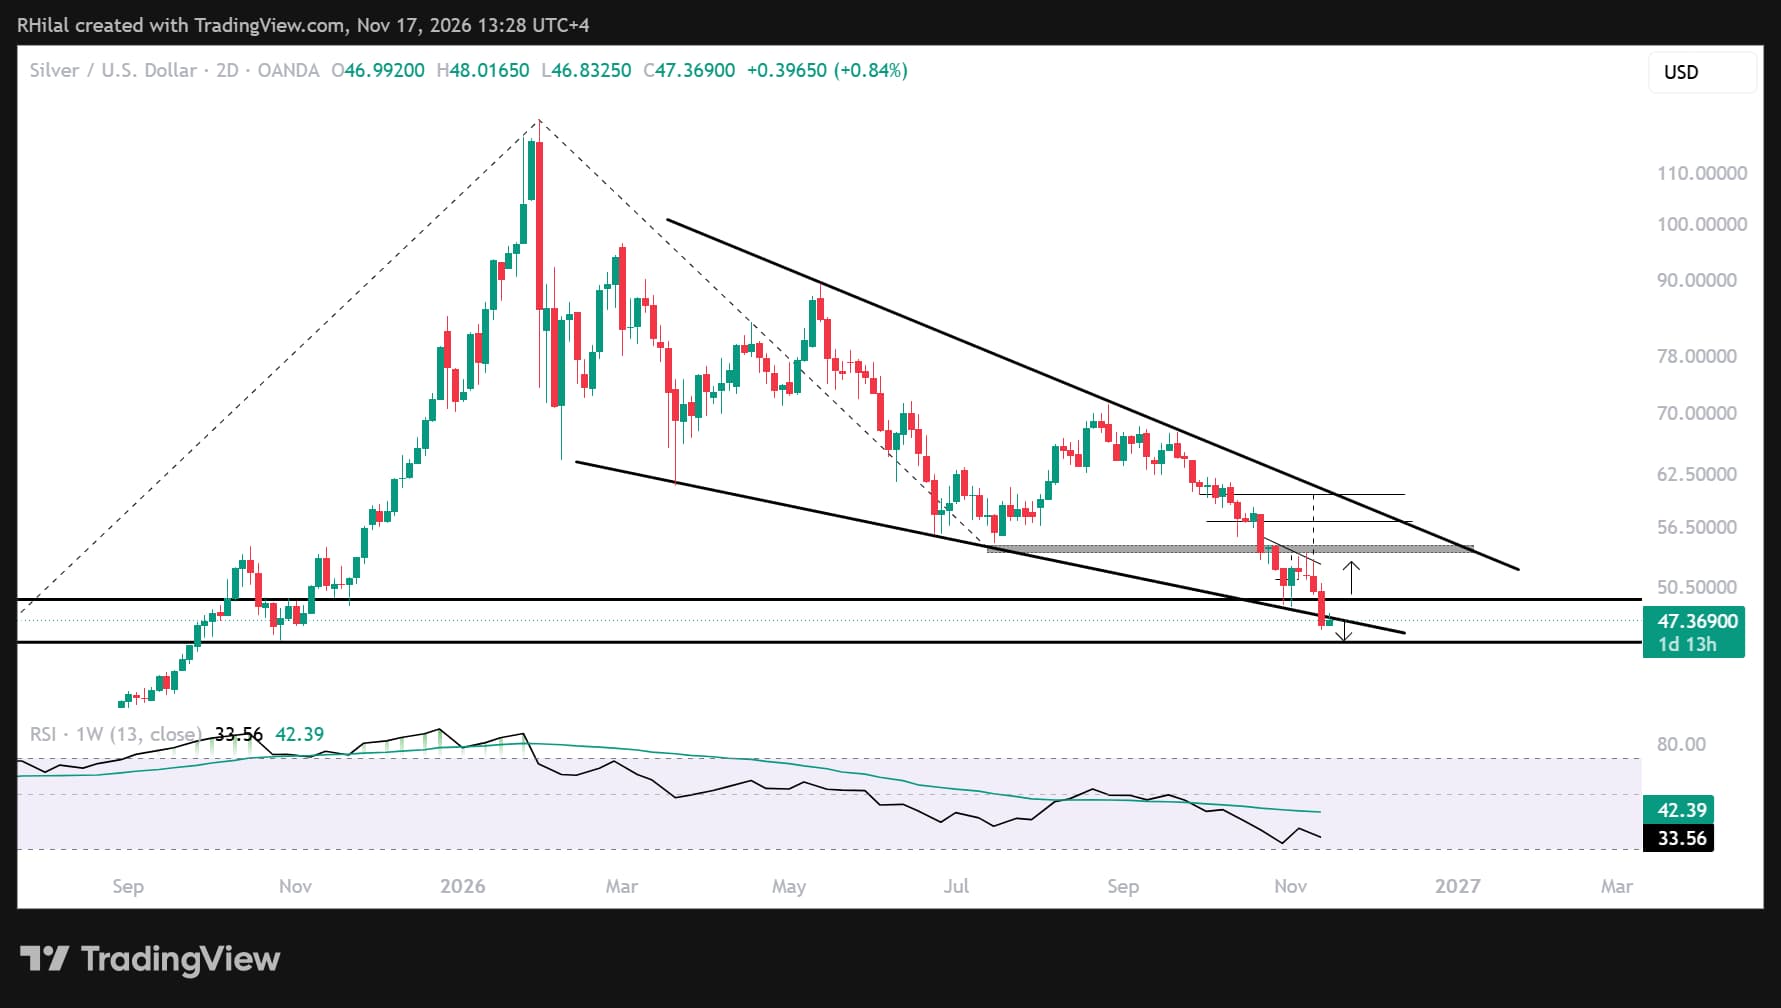
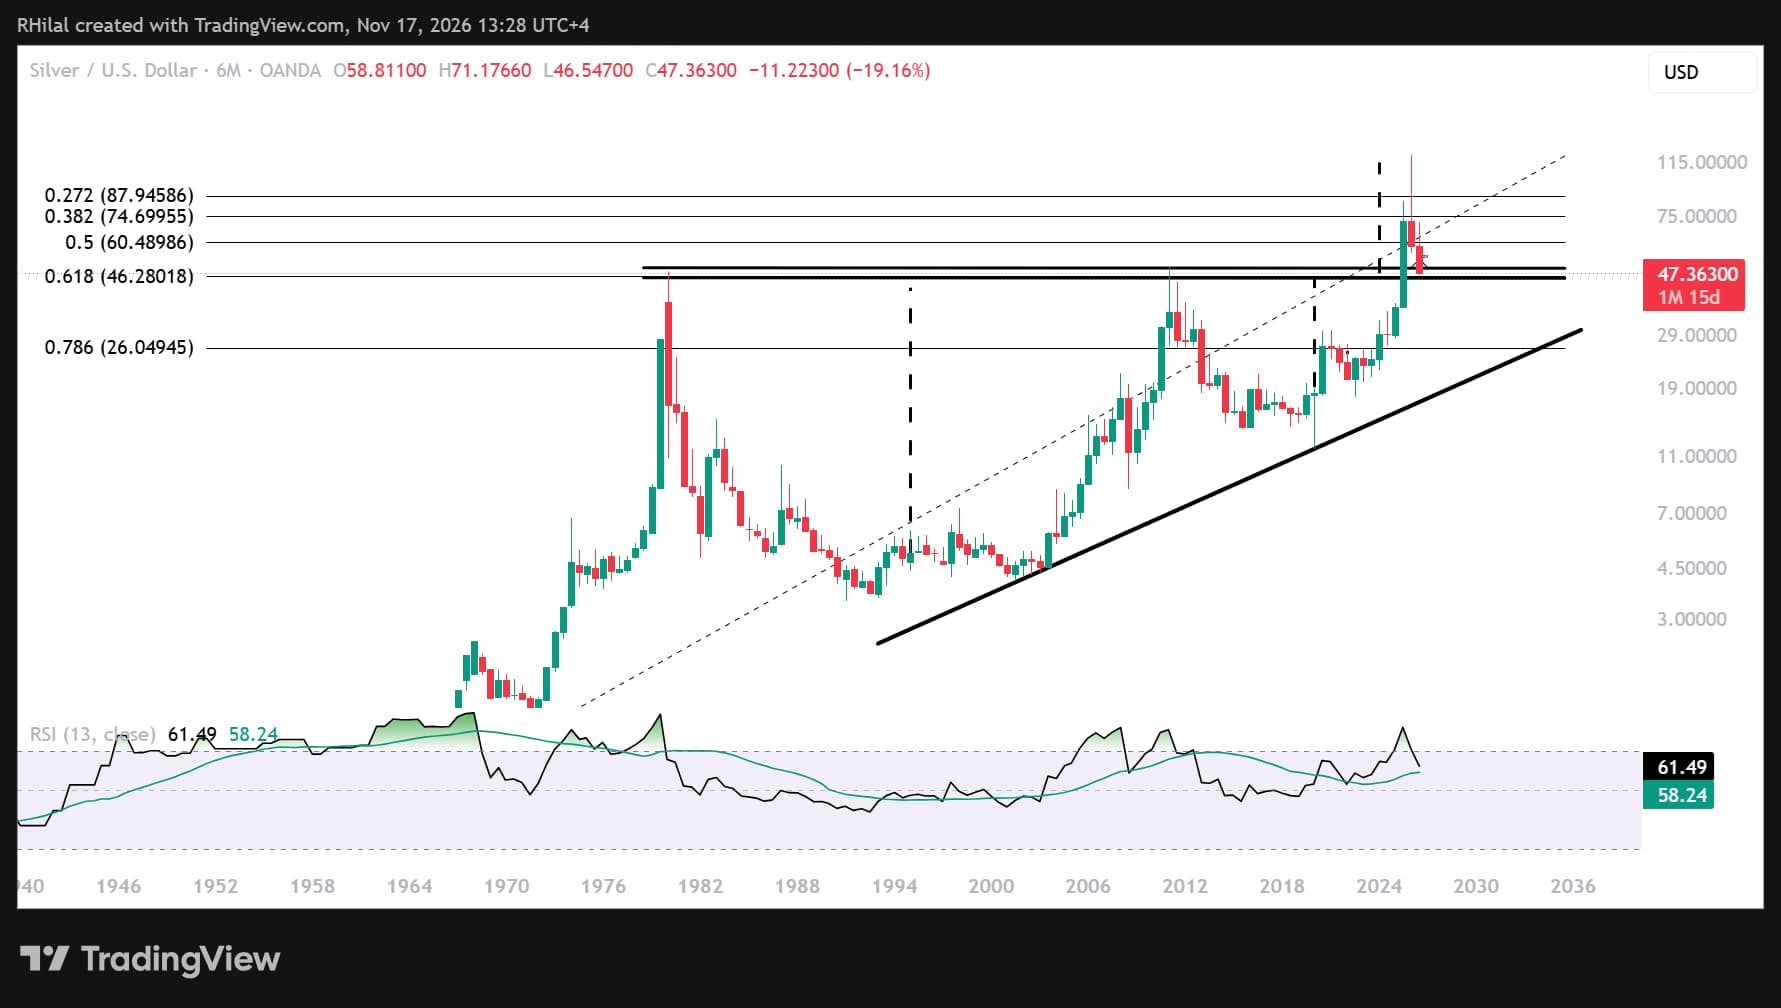
Silver Outlook: Two-Day / Six-Month Time Frame – Log Scale
Source: Trading View
Indicators used: Weekly and six-month RSI, trendlines, Fibonacci retracement and extension tools
Silver’s sell-off has extended below the descending trendline connecting lower lows since February 2026. At the same time, price is approaching a historical confluence zone near 45–45.50, aligning with:
- The October 2025 low
- The 61.8% Fibonacci retracement of the 1930–2026 advance
- Multi-decade resistance dating back to 1980, now acting as support
- Weekly oversold momentum last seen in 2022
This setup brings near- and long-term reversal risks into focus around 45–45.50. A rebound could support a longer-term bullish shift, particularly if risk sentiment improves across equity markets. A move back above 49, followed by 54.80–55, would strengthen the bullish reversal setup. A close below 45, however, could confirm a longer-term bearish shift for the metal.
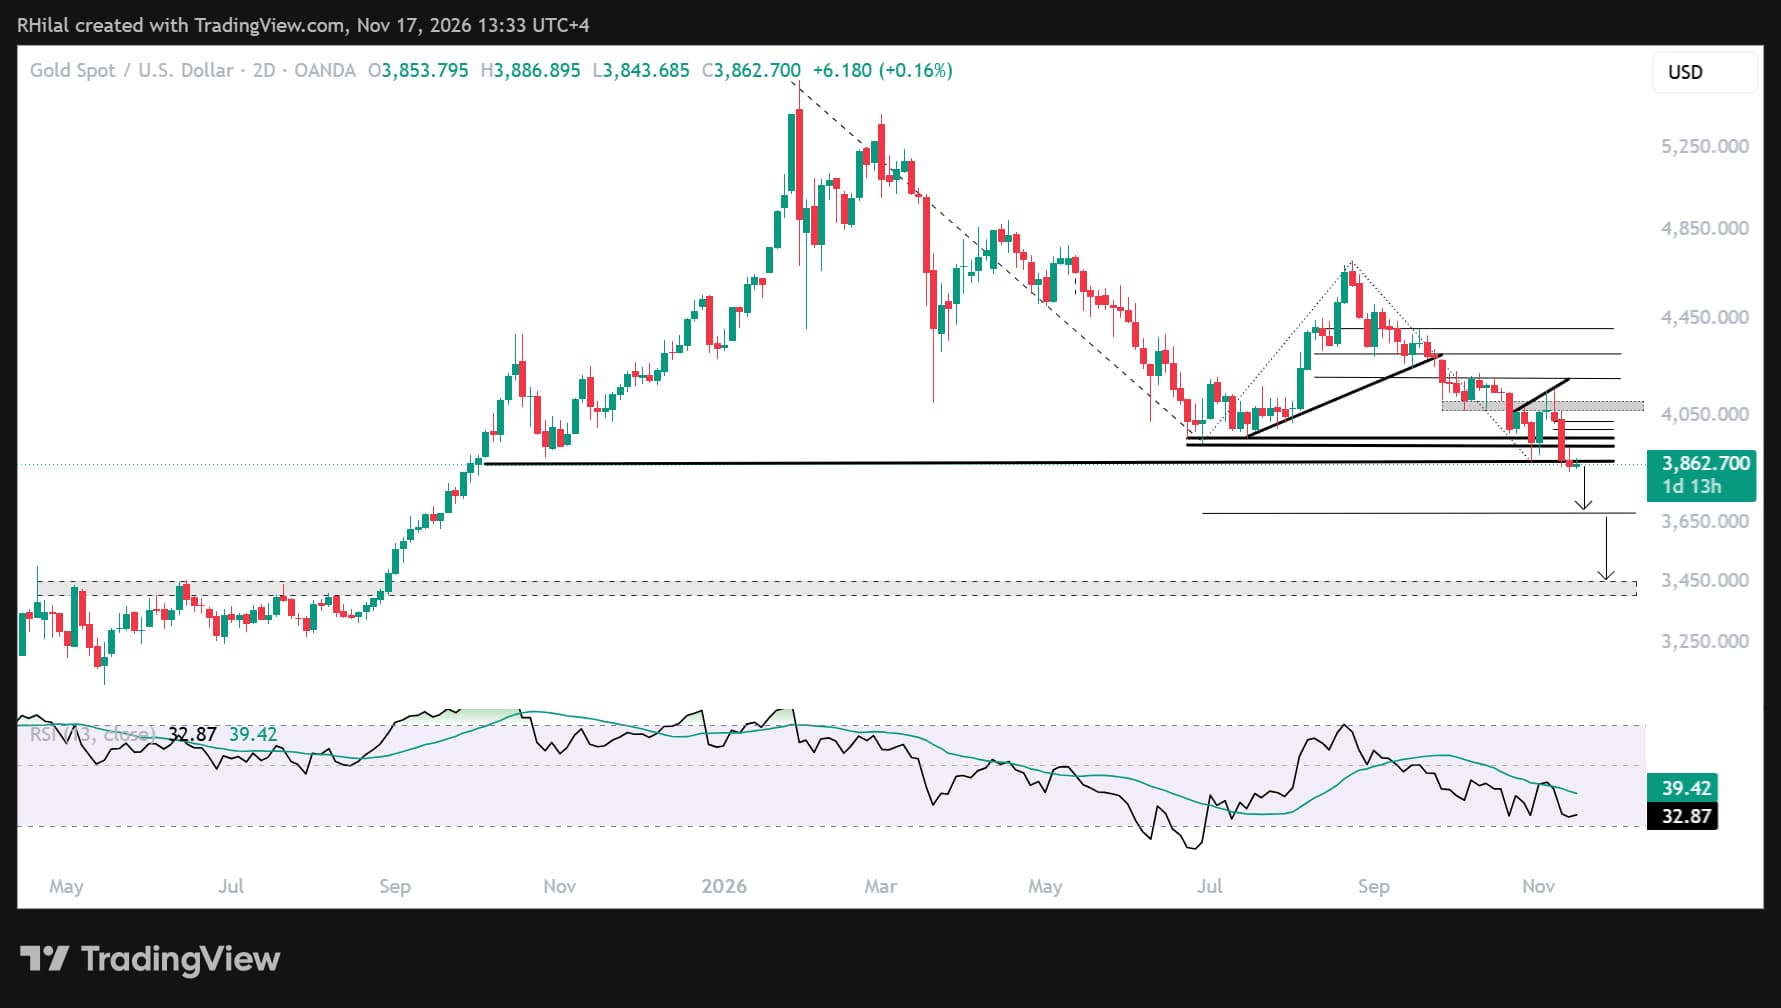
Gold Outlook: Daily Time Frame – Log Scale
Source: Trading View
While silver is testing new 2026 lows, gold is still holding near the 3,870 support zone. A weekly close below this level would increase the risk of an extended sell-off toward 3,680, the 61.8% Fibonacci extension of the January–July–August wave. A further close below 3,860 could expose 3,400, leaving another 200–400 points of downside in focus.
The 3,400 level aligns with a broader market consensus and the multi-month resistance zone from 2025.
On the upside, a broader market recovery could support a reversal in gold from this zone. A close back above the former yearly support levels at 3,930, 3,970 and 4,060 would reinforce bullish continuation risks.
With the euro and silver approaching historical confluence zones, potential market reversals are worth watching despite elevated headline fear. A break of the support or resistance levels above could instead open the door to steeper trend continuation. Key catalysts include Nvidia’s AI outlook, Fed rate-hike expectations and geopolitical developments.
Written by Razan Hilal, CMT
Follow on X: @Rh_waves
Related tags:

Open an account in minutes
Experience award-winning platforms with fast and secure execution.
Economic calendar
Web Trader platform
Our sophisticated web-based platform is packed with features.
Related articles

US Dollar, Gold, Silver Outlook: 2026 Extremes and Key Levels to Watch
US Dollar, Gold, Silver Outlook: Major currency pairs and precious metals are testing 2026 extremes as markets price in a 25-basis-point Fed rate hike in December. However, stretched momentum indicators are bringing near-term reversal risks into focus.

China's steel slump leaves iron ore bulls under the pump
Iron ore has broken major support, threatening a return to the lows of 2022 as mounting evidence of weakness in China's steel sector reinforces the bearish outlook.


NZD/USD Forecast: Kiwi faces historic breakdown as RBNZ survey looms
NZD/USD is teetering above support that held through the pandemic and Liberation Day turmoil. With RBNZ hawks repeatedly disappointed, today's inflation expectations survey could open the door to a slide towards the GFC lows.
StoneX Financial Ltd (trading as "FOREX.com") is an execution-only service provider. This material, whether or not it states any opinions, is for general information purposes only and it does not take into account your personal circumstances or objectives. This material has been prepared using the thoughts and opinions of the author and these may change. However, FOREX.com does not plan to provide further updates to any material once published and it is not under any obligation to keep this material up to date.
This material is short term in nature and may only relate to facts and circumstances existing at a specific time or day. Nothing in this material is (or should be considered to be) financial, investment, legal, tax or other advice and no reliance should be placed on it. No opinion given in this material constitutes a recommendation by FOREX.com or the author that any particular investment, security, transaction or investment strategy is suitable for any specific person.
The material has not been prepared in accordance with legal requirements designed to promote the independence of investment research. Although FOREX.com is not specifically prevented from dealing before providing this material, FOREX.com does not seek to take advantage of the material prior to its dissemination. This material is not intended for distribution to, or use by, any person in any country or jurisdiction where such distribution or use would be contrary to local law or regulation. For further details see our full non-independent research disclaimer and quarterly summary.