



Gold where to next
<p>Gold has been quietly edging higher in recent weeks and today finds itself at just shy of $1110 per troy ounce. From its low point […]</p>
Share this:

Gold has been quietly edging higher in recent weeks and today finds itself at just shy of $1110 per troy ounce. From its low point in December to the high it hit earlier this month, the metal has tacked on a good $65 or just over 6 per cent. Gold’s recovery has been driven almost exclusively by a rise in risk aversion, for the US dollar has also risen during this period. Global stocks have had their worst ever start to a year on fears about a global economic slowdown, most notably in China. At the height of the sell-off, the major global indices were down some 20% or more from their recent record or multi-year highs. When compared to the extent of the stock market’s decline, gold’s performance as a safe haven asset has therefore been poor. If stocks now manage to regain their poise then gold could quickly fall out of favour as investors unwind their safe haven trades. Nevertheless, the metal’s ability to withstand the slightly stronger performance of the US dollar cannot be ignored.
This week’s focus for gold traders, and indeed many other markets, will be the Federal Reserve meeting on Wednesday and Friday’s advance release of US GDP. Virtually no one is expecting the Fed to make any changes to monetary policy at this meeting. The key question is whether the central bank will continue its rate hiking cycle in March or postpone it until June or later. The hope is that the Fed’s policy statement will provide some clarity on this. But according to the Fed Fund Futures, the probability of a rate hike in March has fallen to below 30 per cent, which makes sense given the recent sharp rise stock market volatility and disappointing economic data. The odds for a rate increase in June are about 50 per cent. Thus if the Fed delivers a more dovish-than-expected policy statement, which would imply a later rate hike, then this should decrease the opportunity cost of holding gold. On the other hand, a more hawkish than expected statement would most likely cause gold prices to fall.
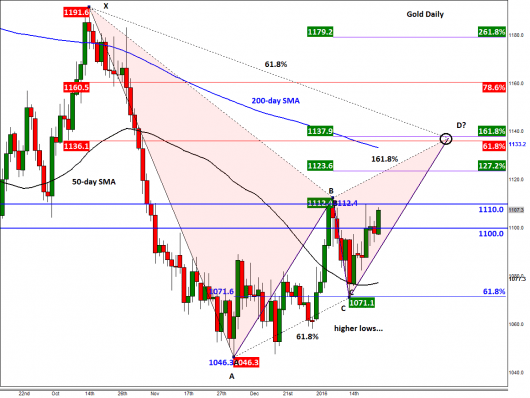
From a technical point of view, gold’s recent price action has been bullish and there may be further momentum left in its current move higher. Since hitting a fresh multi-year low of $1046 at the start of December, the metal has made a series of higher lows with the most recent one being around the 61.8% Fibonacci retracement level at $1071 in mid-January. From here, the metal has steadily risen to approach its recent range highs around $1110/12. A break above this area would probably clear the way towards $1136/8, which is where a clear Bearish Gartley pattern resides. There, the point D of an ABCD price pattern converges with the Fibonacci levels of two price swings: the 61.8% retracement of XA and 161.8% extension of BC. In addition, the 200-day moving average, at $1133/4, also resides in close proximity. Given the conflux of all these technical indicators, this is where we would expect gold to at least face some short-term resistance, should it get there in the first place. If gold breaks above here without much hesitation then it would suggest that we are in the process of a much bigger recovery. Meanwhile if gold fails to even break above the $1110/12 area and subsequently falls back decisively below $1100 then that could signal the end of the short-term bullish trend.
Related tags:
Latest market news




Open an account in minutes
Experience award-winning platforms with fast and secure execution.
Economic calendar
Web Trader platform
Our sophisticated web-based platform is packed with features.
Related articles
Gold and silver forecast: Precious metals extend drop but seasonality hopes keeps bullish case alive
It has been a risk off session so far today with stocks, gold and especially silver (-4%) all taking a drop. Gold has fallen to a fresh 2026 low and its now more than $100 below the psychologically important $4,000 mark. A firmer US dollar, rising US rate expectations and fading safe-haven demand have combined to undermine the metal, despite continued central bank buying. This year has so far been a bad one for gold.


Gold, USD/JPY Forecast: Two trades to watch 161126
Gold falls to a yearly low ahead of FOMC minutes this week. USD/JPY hovers around 160 amid a stronger USD and weaker Japanese GDP.


Gold Outlook: Asia Buys the Dip, US Hammers the Rip
Asia buys the dip, the US sells the rip. Hourly gold, dollar and Treasury yield data reveal a regional divide that has become especially pronounced since September.

StoneX Financial Ltd (trading as "FOREX.com") is an execution-only service provider. This material, whether or not it states any opinions, is for general information purposes only and it does not take into account your personal circumstances or objectives. This material has been prepared using the thoughts and opinions of the author and these may change. However, FOREX.com does not plan to provide further updates to any material once published and it is not under any obligation to keep this material up to date.
This material is short term in nature and may only relate to facts and circumstances existing at a specific time or day. Nothing in this material is (or should be considered to be) financial, investment, legal, tax or other advice and no reliance should be placed on it. No opinion given in this material constitutes a recommendation by FOREX.com or the author that any particular investment, security, transaction or investment strategy is suitable for any specific person.
The material has not been prepared in accordance with legal requirements designed to promote the independence of investment research. Although FOREX.com is not specifically prevented from dealing before providing this material, FOREX.com does not seek to take advantage of the material prior to its dissemination. This material is not intended for distribution to, or use by, any person in any country or jurisdiction where such distribution or use would be contrary to local law or regulation. For further details see our full non-independent research disclaimer and quarterly summary.