


Hang Seng Tech closes in on key hurdle overhead
The price action has improved, the news flow has strengthened and momentum is shifting. But can bulls finally overcome what's proven to be kryptonite for trend break attempts?
Share this:

- China doubles down in AI race
- Hang Seng Tech nears key resistance
- Third time lucky for bulls?
Resistance with a reputation
A fortnight ago, I suggested Hang Seng Tech may have just delivered a near-term bottoming signal. While there have been plenty of false dawns for Chinese tech over the past year, the combination of improving price action and increasingly supportive news flow suggested it was at least worth paying attention to.
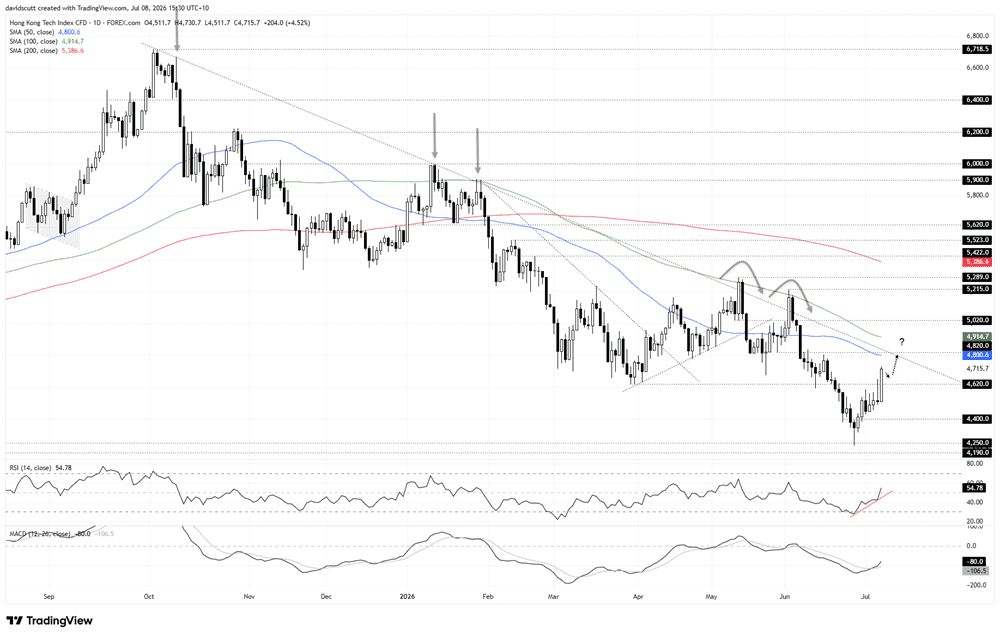
Since then, buyers have delivered. The initial upside target at 4,620 has been reached, with the index now approaching what's proven to be kryptonite for bulls throughout 2026.
Source: TradingView
The combination of long-running downtrend resistance from the October 2025 highs and the 100-day moving average has repeatedly proven to be a formidable hurdle this year. We've seen two false breakouts in May and June, both followed by significant bearish reversals in the days that followed.
We're not there yet, but we're getting close. If buyers can finally overcome this resistance cluster, it would strengthen the case that the move from the June lows is evolving into something more significant than just another bear market bounce.
The AI race intensifies
Just as with the previous tests of this resistance zone, the recent news flow has been uniformly bullish.
Over the past 24 hours, Beijing has delivered another reminder that the global race for AI supremacy is well and truly on. According to media reports, authorities are considering restricting overseas access to China's most advanced AI models, while DeepSeek is reportedly developing its own advanced AI chip in a bid to reduce its reliance on foreign suppliers such as Nvidia.
At the same time, Beijing and Hong Kong have also unveiled fresh measures designed to strengthen the city's standing as the gateway for international capital into Chinese markets, deepening its role in channeling foreign capital into the country's financial markets.
Of course, none of that guarantees the index breaks higher. We've seen plenty of rallies in Chinese technology stocks fizzle after a burst of positive headlines. But this time may be different.
Looking beyond Japan and Korea
After leading the AI trade earlier this year, technology-heavy markets such as Japan and South Korea have come under significant pressure, raising the prospect traders may start looking elsewhere for exposure to the theme. Chinese technology stocks remain relatively unloved compared to many of their global rivals.
Whether that's underway is impossible to know. But if capital is beginning to be redeployed into Chinese technology stocks, which in theory makes sense, the combination of the October downtrend and 100-day moving average looms as the first major test of that thesis.
The trade setup
For those looking to enter bullish positions, 4,620 remains the level to watch. We saw a false breakout delivered on Tuesday, so it warrants close monitoring towards the close. If the price can hold above it on this occasion, longs could be established with a tight stop beneath for protection, initially targeting the 50-day moving average, currently located at 4,800, followed by resistance at 4,820. The long-running downtrend from the October highs intersects with the latter, with the 100-day moving average not far above at 4,914. It marks the top of the resistance zone.
If the price were to break above the latter and hold there, preferably on a closing basis, it may strengthen the case for a more meaningful trend reversal, particularly if the lower swing highs established in June (5,215) and May (5,289) are also surpassed.
On the downside, a reversal back beneath 4,620 would raise concerns about the merits of the latest bounce, potentially bringing 4,400 and June swing low of 4250 onto the radar for shorts.
In terms of momentum, the message from the oscillators has shifted from bearish to neutral. RSI (14) has moved back above 50, while MACD has crossed above its signal line from below, although it remains in negative territory. Combined, the signals suggest bearish strength has faded, leaving directional risk more balanced.
Latest market news




Open an account in minutes
Experience award-winning platforms with fast and secure execution.
Economic calendar
Web Trader platform
Our sophisticated web-based platform is packed with features.
Related articles
NZD/USD Forecast: Kiwi faces historic breakdown as RBNZ survey looms
NZD/USD is teetering above support that held through the pandemic and Liberation Day turmoil. With RBNZ hawks repeatedly disappointed, today's inflation expectations survey could open the door to a slide towards the GFC lows.
USD/JPY, AUD/JPY: Central Bank Divergence Creates Two-Way Risk
USD/JPY eyes a breakout above 160, while AUD/JPY faces further losses as Fed, RBA and BoJ interest rate expectations diverge.

DXY, GBP/USD, AUD/USD, USD/CAD, USD/JPY, Gold Weekly Technical Outlook 11 16 2026
Sr. Technical Strategist Michael Boutros highlights the levels that matter on the USD Majors, commodities, and equity indices charts this week.

StoneX Financial Ltd (trading as "FOREX.com") is an execution-only service provider. This material, whether or not it states any opinions, is for general information purposes only and it does not take into account your personal circumstances or objectives. This material has been prepared using the thoughts and opinions of the author and these may change. However, FOREX.com does not plan to provide further updates to any material once published and it is not under any obligation to keep this material up to date.
This material is short term in nature and may only relate to facts and circumstances existing at a specific time or day. Nothing in this material is (or should be considered to be) financial, investment, legal, tax or other advice and no reliance should be placed on it. No opinion given in this material constitutes a recommendation by FOREX.com or the author that any particular investment, security, transaction or investment strategy is suitable for any specific person.
The material has not been prepared in accordance with legal requirements designed to promote the independence of investment research. Although FOREX.com is not specifically prevented from dealing before providing this material, FOREX.com does not seek to take advantage of the material prior to its dissemination. This material is not intended for distribution to, or use by, any person in any country or jurisdiction where such distribution or use would be contrary to local law or regulation. For further details see our full non-independent research disclaimer and quarterly summary.