




Index in focus: DJIA (US 30) coiling below key resistance
This week’s tight range signals a fine balance between buyers and sellers, but the short-term momentum still remains with the bulls...
Share this:

Since bottoming just over a month ago, major US indices have staged a furious bounce to their highest levels since September. Surprisingly for some traders, this rally has been led by the stodgy Dow Jones Industrial Average (+19% trough-to-peak rally), rather than the broader S&P 500 (+15%) or the previously high-flying Nasdaq 100 index of technology stocks (+14%).
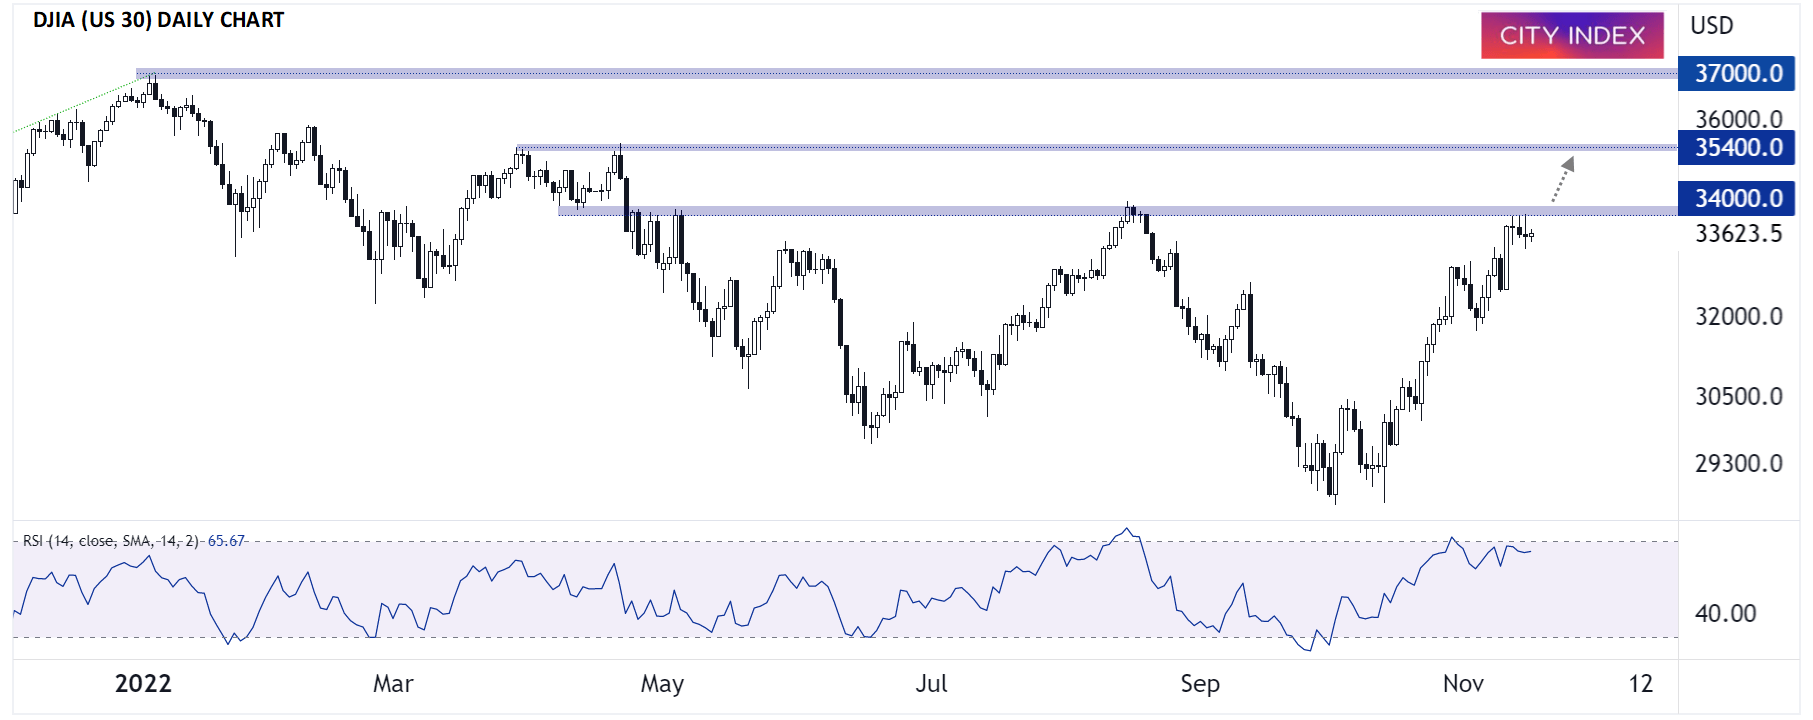
As the chart below shows, the DJIA (US 30) has spent this week coiling just below key resistance around 34,000. After a big rally into resistance, this week’s tight range signals a fine balance between buyers and sellers, but the short-term momentum still remains with the bulls, so if prices can break and close conclusively above 34,000, a bullish continuation toward the March/April highs in the mid-35,000s may be next.
Source: TradingView, StoneX
In terms of fundamental catalysts, we’re nearing the end of a mediocre-but-still-better-than-expected Q3 earnings season for US stocks, so traders are likely to shift their focus to macroeconomic data heading into the holidays. Specifically, the more timely, on-the-ground style of reports – including the regional Fed indices and PMI readings – will be worth watching for early signs that the US economy may be heading into a recession. Of course, the top-tier reports for the rest of the year will be inflation data (CPI and Core PCE), as well as the Fed’s hotly-anticipated monetary policy meeting in mid-December.
After months of “bad (economic) news is good news (for the stock market),” we may be nearing an inflection point as we approach peak Fed Funds rates around 5%. Now, instead of worrying what economic data may mean for the Fed, which appears set to gradually slow rate hikes over the next few months, traders will key in on what it means for underlying US economy and the potential for a recession in 2023.
In that vein, DJIA bulls would prefer to see strong economic data to support a continued rally to 35,000 or beyond in the index.
How to trade with FOREX.com
Follow these easy steps to start trading with FOREX.com today:
- Open a Forex.com account, or log-in if you’re already a customer.
- Search for the pair you want to trade in our award-winning platform.
- Choose your position and size, and your stop and limit levels.
- Place the trade.
Since bottoming just over a month ago, major US indices have staged a furious bounce to their highest levels since September. Surprisingly for some traders, this rally has been led by the stodgy Dow Jones Industrial Average (+19% trough-to-peak rally), rather than the broader S&P 500 (+15%) or the previously high-flying Nasdaq 100 index of technology stocks (+14%).
As the chart below shows, the DJIA (US 30) has spent this week coiling just below key resistance around 34,000. After a big rally into resistance, this week’s tight range signals a fine balance between buyers and sellers, but the short-term momentum still remains with the bulls, so if prices can break and close conclusively above 34,000, a bullish continuation toward the March/April highs in the mid-35,000s may be next.
Source: TradingView, StoneX
In terms of fundamental catalysts, we’re nearing the end of a mediocre-but-still-better-than-expected Q3 earnings season for US stocks, so traders are likely to shift their focus to macroeconomic data heading into the holidays. Specifically, the more timely, on-the-ground style of reports – including the regional Fed indices and PMI readings – will be worth watching for early signs that the US economy may be heading into a recession. Of course, the top-tier reports for the rest of the year will be inflation data (CPI and Core PCE), as well as the Fed’s hotly-anticipated monetary policy meeting in mid-December.
After months of “bad (economic) news is good news (for the stock market),” we may be nearing an inflection point as we approach peak Fed Funds rates around 5%. Now, instead of worrying what economic data may mean for the Fed, which appears set to gradually slow rate hikes over the next few months, traders will key in on what it means for underlying US economy and the potential for a recession in 2023.
In that vein, DJIA bulls would prefer to see strong economic data to support a continued rally to 35,000 or beyond in the index.
How to trade with City Index
You can trade with City Index by following these four easy steps:
- Open an account, or log in if you’re already a customer
• Open an account in the UK
• Open an account in Australia
• Open an account in Singapore
- Search for the market you want to trade in our award-winning platform
- Choose your position and size, and your stop and limit levels
- Place the trade
Related tags:
Latest market news




Open an account in minutes
Experience award-winning platforms with fast and secure execution.
Economic calendar
Web Trader platform
Our sophisticated web-based platform is packed with features.
Related articles
NZD/USD Forecast: Kiwi faces historic breakdown as RBNZ survey looms
NZD/USD is teetering above support that held through the pandemic and Liberation Day turmoil. With RBNZ hawks repeatedly disappointed, today's inflation expectations survey could open the door to a slide towards the GFC lows.
DXY, GBP/USD, AUD/USD, USD/CAD, USD/JPY, Gold Weekly Technical Outlook 11 16 2026
Sr. Technical Strategist Michael Boutros highlights the levels that matter on the USD Majors, commodities, and equity indices charts this week.


Crude Oil Weekly Outlook: Geopolitics vs Oversupply Risks
Crude Oil Weekly Outlook: The IEA has flagged the risk of an oil supply surplus since the Iran war began. Yet WTI and Brent have held onto bullish rebounds from key support near 84 and 89, respectively, as geopolitical risks persist.

StoneX Financial Ltd (trading as "FOREX.com") is an execution-only service provider. This material, whether or not it states any opinions, is for general information purposes only and it does not take into account your personal circumstances or objectives. This material has been prepared using the thoughts and opinions of the author and these may change. However, FOREX.com does not plan to provide further updates to any material once published and it is not under any obligation to keep this material up to date.
This material is short term in nature and may only relate to facts and circumstances existing at a specific time or day. Nothing in this material is (or should be considered to be) financial, investment, legal, tax or other advice and no reliance should be placed on it. No opinion given in this material constitutes a recommendation by FOREX.com or the author that any particular investment, security, transaction or investment strategy is suitable for any specific person.
The material has not been prepared in accordance with legal requirements designed to promote the independence of investment research. Although FOREX.com is not specifically prevented from dealing before providing this material, FOREX.com does not seek to take advantage of the material prior to its dissemination. This material is not intended for distribution to, or use by, any person in any country or jurisdiction where such distribution or use would be contrary to local law or regulation. For further details see our full non-independent research disclaimer and quarterly summary.