



S P 500 Stocks tanks as ECB misfires bazooka
<p>What a volatile day it has been in the markets. Stocks initially rallied after the European Central Bank decided to cut interest rates across the board, increased QE by a bigger than expected €20 billion euros per month and expanded the universe of eligible securities to purchase through its QE programme. In the words of my colleague Matt Weller, this was the “big bazooka” that many traders were hoping to see. However, at the press conference, the ECB President Mario Draghi said he didn’t expect to cut interest rates further. This was enough to send German 10-year bond prices tumbling and yields to jump, nearly double from their lunch-time levels. The euro shot higher and stocks, which have been correlating positively with bonds, tanked.</p>
Share this:

What a volatile day it has been in the markets. Stocks initially rallied after the European Central Bank decided to cut interest rates across the board, increased QE by a bigger than expected €20 billion euros per month and expanded the universe of eligible securities to purchase through its QE programme – click HERE for more details. In the words of my colleague Matt Weller, this was the "big bazooka" that many traders were hoping to see. However, at the press conference, the ECB President Mario Draghi said he didn’t expect to cut interest rates further. This was enough to send German 10-year bond prices tumbling and yields to jump, nearly double from their lunch-time levels. The euro shot higher and stocks, which have been correlating positively with bonds, tanked.
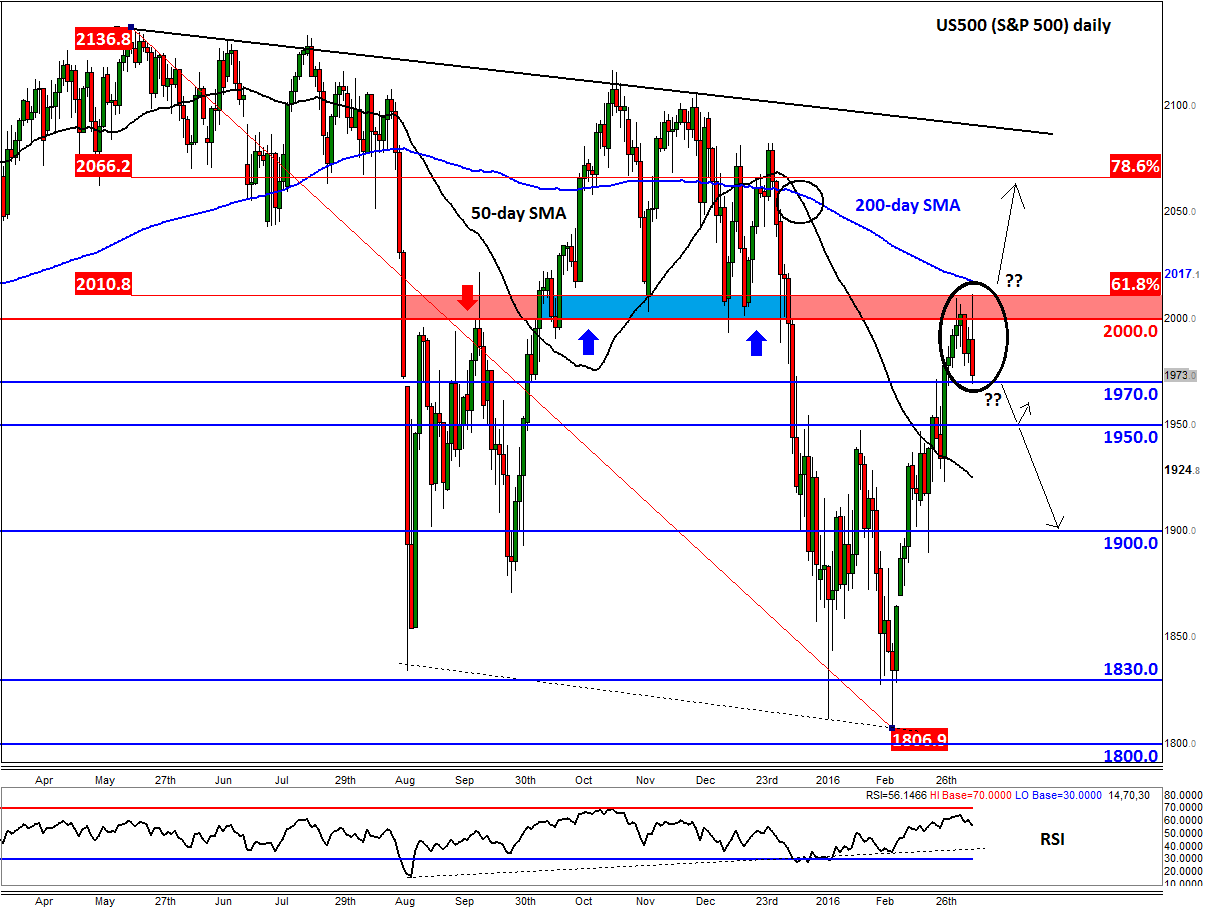
US stocks also dropped, with the S&P 500’s earlier advance being rejected sharply at a key level: 2010. As can be seen from the chart, this level corresponds with the 61.8% Fibonacci retracement against the all-time high. In addition, the area below this 2010 level and above 2000 had been strong support in the past, which has now turned into resistance (shaded in red on the chart). Given the technical importance of this area, a sell-off here looked almost inevitable. So, at this stage, traders need to be open minded to the fact this could just be a short-term pullback rather than the start of another major leg lower.
But if the index closes near its lows, it will form a large bearish engulfing candle and a double top pattern on the intra-day charts at just below 2010. The bearish engulfing candle, if seen, would indicate a clear change in the short term trend. In this scenario, the S&P could break below short-term support at 1970 and potentially drop to test the old support at 1950 before deciding on its next move, which could well be to the downside given the fact that the moving averages are also pointing lower.
However if the buyers step in here and eventually push the index beyond the 2000-2010 resistance range in the coming days then a rally towards the 78.6% Fibonacci retracement at 2066 or the bearish trend line slightly higher wouldn’t surprise me.
Related tags:


Open an account in minutes
Experience award-winning platforms with fast and secure execution.
Economic calendar
Web Trader platform
Our sophisticated web-based platform is packed with features.
Related articles
China's steel slump leaves iron ore bulls under the pump
Iron ore has broken major support, threatening a return to the lows of 2022 as mounting evidence of weakness in China's steel sector reinforces the bearish outlook.

NZD/USD Forecast: Kiwi faces historic breakdown as RBNZ survey looms
NZD/USD is teetering above support that held through the pandemic and Liberation Day turmoil. With RBNZ hawks repeatedly disappointed, today's inflation expectations survey could open the door to a slide towards the GFC lows.

DXY, GBP/USD, AUD/USD, USD/CAD, USD/JPY, Gold Weekly Technical Outlook 11 16 2026
Sr. Technical Strategist Michael Boutros highlights the levels that matter on the USD Majors, commodities, and equity indices charts this week.

StoneX Financial Ltd (trading as "FOREX.com") is an execution-only service provider. This material, whether or not it states any opinions, is for general information purposes only and it does not take into account your personal circumstances or objectives. This material has been prepared using the thoughts and opinions of the author and these may change. However, FOREX.com does not plan to provide further updates to any material once published and it is not under any obligation to keep this material up to date.
This material is short term in nature and may only relate to facts and circumstances existing at a specific time or day. Nothing in this material is (or should be considered to be) financial, investment, legal, tax or other advice and no reliance should be placed on it. No opinion given in this material constitutes a recommendation by FOREX.com or the author that any particular investment, security, transaction or investment strategy is suitable for any specific person.
The material has not been prepared in accordance with legal requirements designed to promote the independence of investment research. Although FOREX.com is not specifically prevented from dealing before providing this material, FOREX.com does not seek to take advantage of the material prior to its dissemination. This material is not intended for distribution to, or use by, any person in any country or jurisdiction where such distribution or use would be contrary to local law or regulation. For further details see our full non-independent research disclaimer and quarterly summary.