



SP 500 Near January Peak as RecordSetting Earnings Season Winds Down
Through Friday, 91% of the companies in the S&P 500 had reported earnings, and according to the earnings mavens at FactSet, this earnings season has broken all sorts of records.
Share this:

Sparkling.
Spectacular.
Stellar.
Sterling.
Stupendous.
Super.
…and those are just the adjectives starting “Sp” through “Su” that describe Q2 earnings season for the S&P 500. Through Friday, 91% of the companies in the S&P 500 had reported earnings, and according to the earnings mavens at FactSet, this earnings season has broken all sorts of records.
To date, 79% of companies have reported earnings above analysts’ estimates, which if maintained, would be the highest “beat rate” since FactSet began tracking that metric in 2008 (the current record is last quarter’s 78% beat rate). The “blended” (combining actual reported results with analyst estimates) year-over-year earnings growth rate sits at 24.6% today, with all 11 sectors reporting double-digit earnings growth. Of course, this is significantly higher than the still-impressive blended revenue growth rate (9.9%) due to general operating leverage and last year’s big tax cut.
When evaluating the health of a market, it can also be useful to evaluate investors’ sentiment, not just the raw economic results of the companies. On that front too, market investors appear enthused. Based on FactSet’s data, companies reporting positive earnings surprises have seen an average gain of 1.2% over that week, above the 5-year average increase of 1.0%. Meanwhile, companies reporting negative earnings surprises have fallen an average of -2.0%, above the 5-year average of a -2.5% return. In other words, investors have been more encouraged by positive results and less concerned with negative earnings figures than usual. On the whole, the S&P 500 is trading higher by about 5% since earnings season kicked off, though obviously there are plenty of macroeconomic and geopolitical crosswinds in play.
Technical View: S&P 500
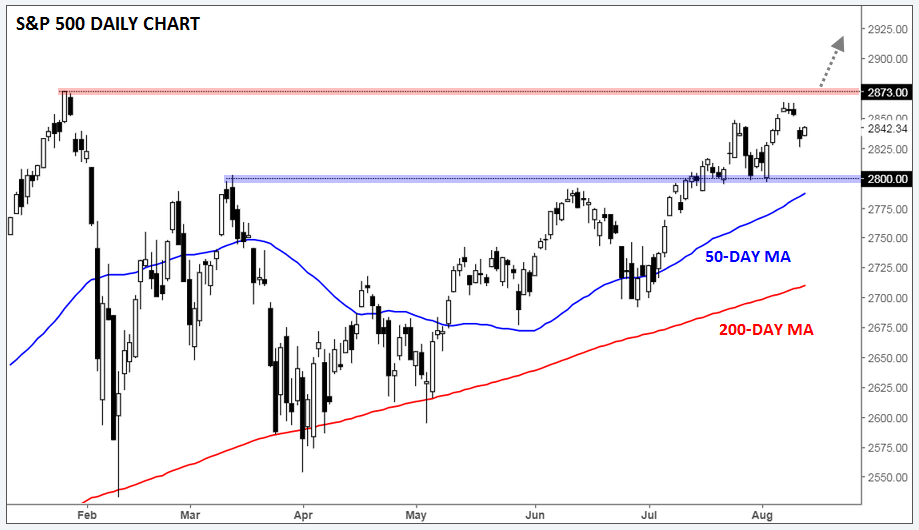
Longer-term, the S&P 500’s uptrend remains healthy. The index is trading above its 50- and 200- day moving averages, both of which are trending higher. While US stocks did see a big swoon off the late January highs, prices spent a full six months consolidating between 2600 and 2800 before breaking higher last month.
Technically speaking, the next major hurdle will be January’s record highs at 2873, with a break above that barrier opening the door for another leg higher. To the downside, the confluence of previous-resistance-turned-support at 2800 and the rising 50-day moving average could provide support on any near-term dips, with the 200-day moving average near 2725 serving as another potential floor if that level gives way.
Source: TradingView, FOREX.com


Open an account in minutes
Experience award-winning platforms with fast and secure execution.
Economic calendar
Web Trader platform
Our sophisticated web-based platform is packed with features.
Related articles
China's steel slump leaves iron ore bulls under the pump
Iron ore has broken major support, threatening a return to the lows of 2022 as mounting evidence of weakness in China's steel sector reinforces the bearish outlook.

NZD/USD Forecast: Kiwi faces historic breakdown as RBNZ survey looms
NZD/USD is teetering above support that held through the pandemic and Liberation Day turmoil. With RBNZ hawks repeatedly disappointed, today's inflation expectations survey could open the door to a slide towards the GFC lows.

DXY, GBP/USD, AUD/USD, USD/CAD, USD/JPY, Gold Weekly Technical Outlook 11 16 2026
Sr. Technical Strategist Michael Boutros highlights the levels that matter on the USD Majors, commodities, and equity indices charts this week.

StoneX Financial Ltd (trading as "FOREX.com") is an execution-only service provider. This material, whether or not it states any opinions, is for general information purposes only and it does not take into account your personal circumstances or objectives. This material has been prepared using the thoughts and opinions of the author and these may change. However, FOREX.com does not plan to provide further updates to any material once published and it is not under any obligation to keep this material up to date.
This material is short term in nature and may only relate to facts and circumstances existing at a specific time or day. Nothing in this material is (or should be considered to be) financial, investment, legal, tax or other advice and no reliance should be placed on it. No opinion given in this material constitutes a recommendation by FOREX.com or the author that any particular investment, security, transaction or investment strategy is suitable for any specific person.
The material has not been prepared in accordance with legal requirements designed to promote the independence of investment research. Although FOREX.com is not specifically prevented from dealing before providing this material, FOREX.com does not seek to take advantage of the material prior to its dissemination. This material is not intended for distribution to, or use by, any person in any country or jurisdiction where such distribution or use would be contrary to local law or regulation. For further details see our full non-independent research disclaimer and quarterly summary.