






Stocks Continue to be Slammed VIX Breaks Out
The SP500 Index is down over 100 handles the past 2 days
Share this:

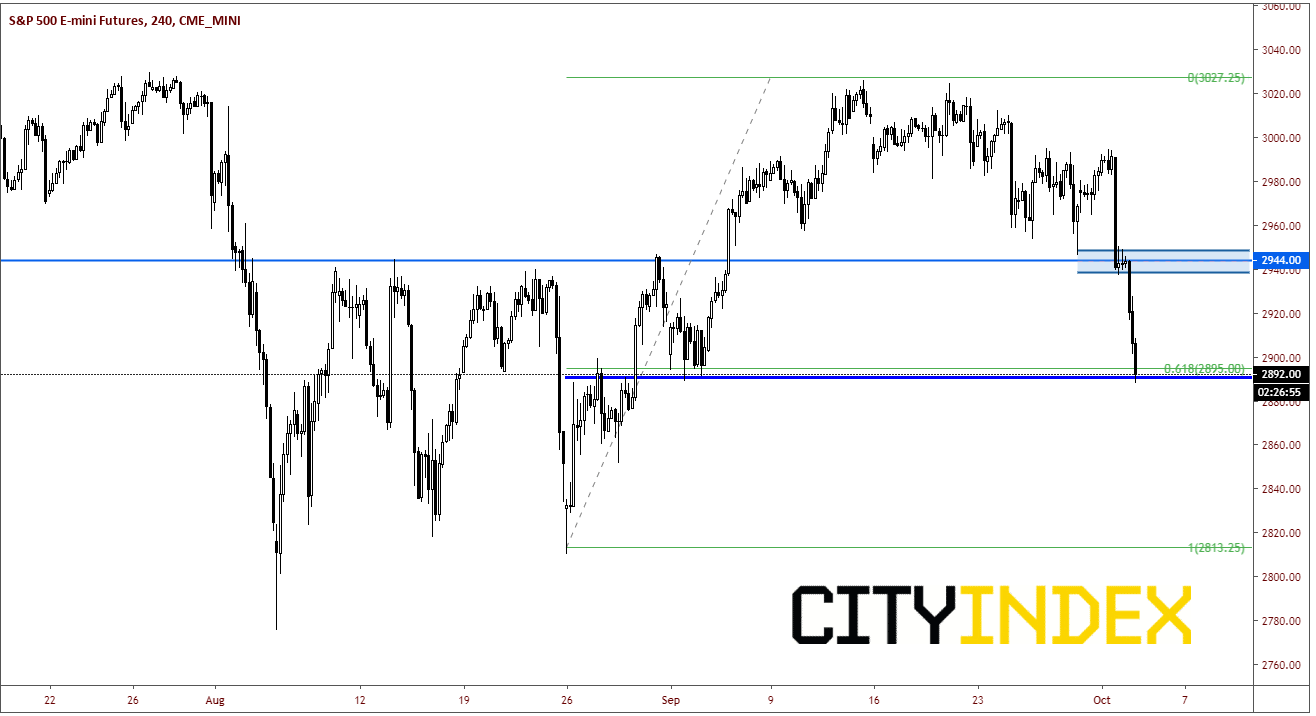
SP500 Futures continued its selloff that began yesterday after today’s worse than expected ADP Nonfarm Employment Change for September. Although the headline number was in line for the most part (135K vs 140K expected), it was the revision from August 195K down to 157K the made this data much worse than expected. This comes after yesterday’s worse than expected US ISM Manufacturing PMI for September. The index is down over 100 handles over the past 2 days near 2891. The daily chart shows SP500 Futures broke key support near 2944, which was strong horizontal resistance on the way up. Currently price is sitting at the 61.8% retracement from the August 26th lows to the September 13th highs. If price breaks lower from here, it looks possible to retrace all the way back down the 2813.
Source: Tradingview, City Index, CME
If we zoom in on a 240-minute chart, resistance doesn’t come into play until way above in the 2440/2450 zone.
Source: Tradingview, City Index, CME
As one would expect, the Volatility SP500 Index, better know as the VIX, has gapped higher today. The 240-minute chart shows the VIX broke out of a descending wedge is late September and came back to test the downward slowing trendline twice, before finally breaking higher today. Horizontal resistance comes in at 21.60. Above that is the August 5th highs at 24.80. First support is back at the gap at 18.60. (note that the RSI is moving into overbought territory, so we may see a pullback shortly, or at least a sideways move so the RSI indicator can move back within the neutral range).
Source: Tradingview, City Index
The next catalyst seems like it can come from anywhere at this point. The political is very contentious within the US, Brexit discussions are ongoing, and on Friday, the US Nonfarm Payrolls data is released. Once again, be on alert for headlines and tweets!
SP500 Futures continued its selloff that began yesterday after today’s worse than expected ADP Nonfarm Employment Change for September. Although the headline number was in line for the most part (135K vs 140K expected), it was the revision from August 195K down to 157K the made this data much worse than expected. This comes after yesterday’s worse than expected US ISM Manufacturing PMI for September. The index is down over 100 handles over the past 2 days near 2891. The daily chart shows SP500 Futures broke key support near 2944, which was strong horizontal resistance on the way up. Currently price is sitting at the 61.8% retracement from the August 26th lows to the September 13th highs. If price breaks lower from here, it looks possible to retrace all the way back down the 2813.
Source: Tradingview, FOREX.com, CME
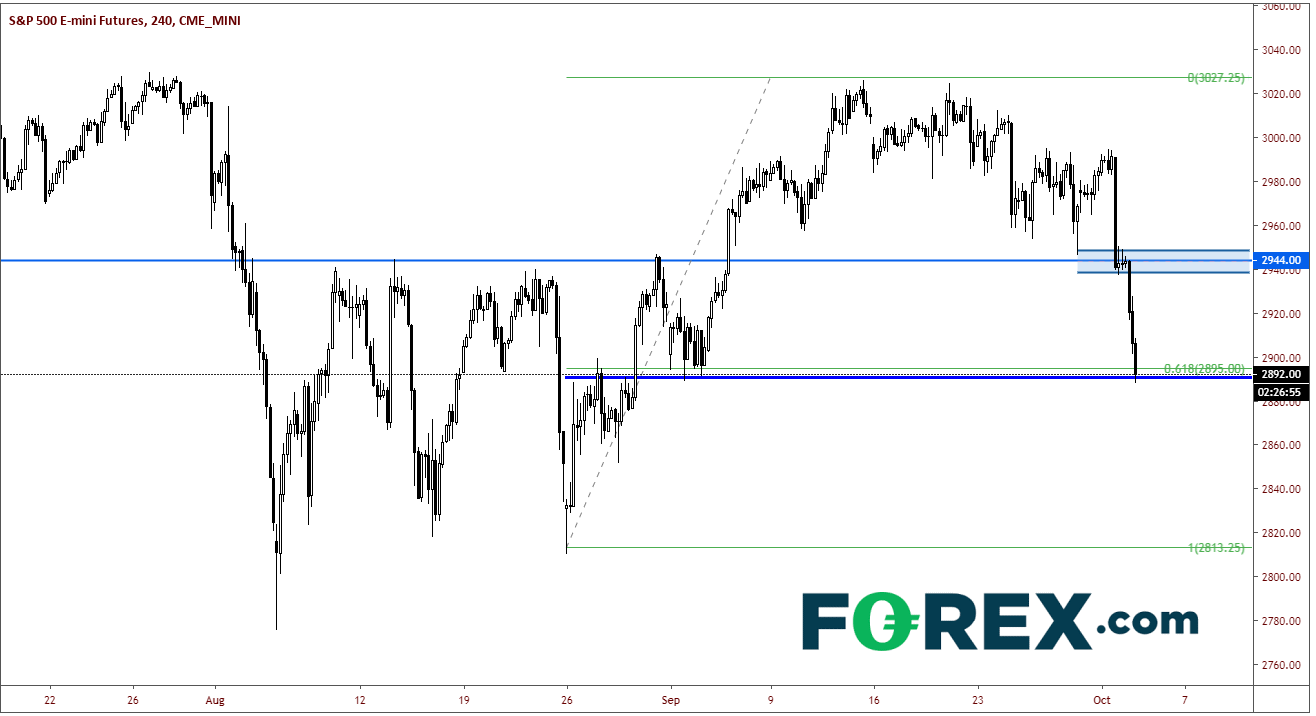
If we zoom in on a 240-minute chart, resistance doesn’t come into play until way above in the 2440/2450 zone.
Source: Tradingview, FOREX.com, CME
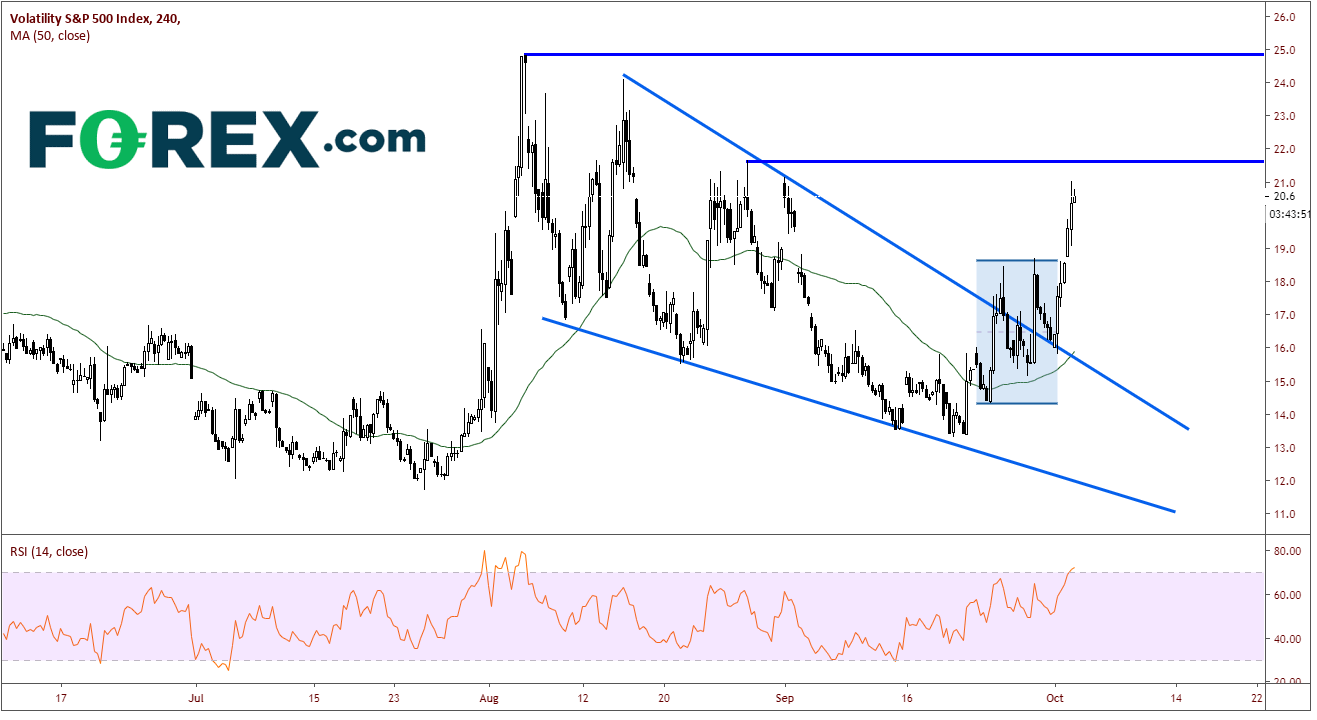
As one would expect, the Volatility SP500 Index, better know as the VIX, has gapped higher today. The 240-minute chart shows the VIX broke out of a descending wedge is late September and came back to test the downward slowing trendline twice, before finally breaking higher today. Horizontal resistance comes in at 21.60. Above that is the August 5th highs at 24.80. First support is back at the gap at 18.60. (note that the RSI is moving into overbought territory, so we may see a pullback shortly, or at least a sideways move so the RSI indicator can move back within the neutral range).
Source: Tradingview, FOREX.com
The next catalyst seems like it can come from anywhere at this point. The political is very contentious within the US, Brexit discussions are ongoing, and on Friday, the US Nonfarm Payrolls data is released. Once again, be on alert for headlines and tweets!
Related tags:
Latest market news




Open an account in minutes
Experience award-winning platforms with fast and secure execution.
Economic calendar
Web Trader platform
Our sophisticated web-based platform is packed with features.
Related articles

EUR/USD Forecast: Euro Under Pressure After Strong NFP Data
As the trading week comes to an end, the euro has once again struggled to sustain a meaningful recovery against the U.S. dollar, highlighting renewed weakness within EUR/USD price action. During the final trading session of the week, the pair declined nearly 0.7%, reflecting that confidence around the European currency remains limited in the short term.


US Dollar Bears Lose Their Grip Ahead of NFP, USD/JPY Vols Elevated
US dollar selling pressure fades ahead of NFP as Fed hike bets retreat. USD/JPY stands out with a 141-pip implied move as FX volatility takes centre stage.

NFP Preview: New Government, Same Jobs Market?
Traders are still sifting through the fallout of the US midterm elections, just in time to get hit with another volatility: The monthly Non-Farm Payrolls (NFP) report - what will the jobs report show, and what could it mean for the US dollar?

StoneX Financial Ltd (trading as "FOREX.com") is an execution-only service provider. This material, whether or not it states any opinions, is for general information purposes only and it does not take into account your personal circumstances or objectives. This material has been prepared using the thoughts and opinions of the author and these may change. However, FOREX.com does not plan to provide further updates to any material once published and it is not under any obligation to keep this material up to date.
This material is short term in nature and may only relate to facts and circumstances existing at a specific time or day. Nothing in this material is (or should be considered to be) financial, investment, legal, tax or other advice and no reliance should be placed on it. No opinion given in this material constitutes a recommendation by FOREX.com or the author that any particular investment, security, transaction or investment strategy is suitable for any specific person.
The material has not been prepared in accordance with legal requirements designed to promote the independence of investment research. Although FOREX.com is not specifically prevented from dealing before providing this material, FOREX.com does not seek to take advantage of the material prior to its dissemination. This material is not intended for distribution to, or use by, any person in any country or jurisdiction where such distribution or use would be contrary to local law or regulation. For further details see our full non-independent research disclaimer and quarterly summary.