



Stocks metals and Aussie rally on US China trade dispute relief
The biggest story in the markets right now is that China seems to have blinked first in its trade dispute with the US. Global stock markets, led by China, and base metal prices have all staged a relief rally as a result.
Share this:

The biggest story in the markets right now is that China seems to have blinked first in its trade dispute with the US. Global stock markets, led by China, and base metal prices have all staged a relief rally as a result. The firmer metal prices and positive risk sentiment has helped to boost the Australian dollar in particular.
Although China retaliated yesterday to the latest imposition of tariffs by the US, Beijing nevertheless sharply slashed its tariff rates on imports of US goods compared to what it had proposed previously. So, China in particular appears willing to talk and this has boosted speculation among market participants that an agreement will be formed at a not-so-distant future despite the growing trade dispute.
Sentiment has been further boosted after China’s Premier Li Keqiang pledged a series of pro-business policies overnight. Among the measures, the equal treatment for foreign investors is a blatant effort to retain investor confidence in the wake of the growing trade dispute with the US. Meanwhile yuan devaluation talks came back into focus after Li Keqiang said that China won’t devalue its currency to stimulate exports.
The Chinese Premier was speaking at a World Economic Forum event in Tianjin and his comments were cheered on by the Aussie bulls in particular, although the kiwi also gained ground.
Despite the tariffs, China's exports haven't slowed down to worrying levels just yet. In August, exports in dollar terms showed a growth of 9.8% year-on-year. Although this represents a slowdown from July's 12.2% reading, it is still a relatively strong number.
For China, which is fast becoming a consumer nation as opposed to just a producer, it does not make sense to devalue the yuan extensively in the wake of the ongoing trade war. Indeed, Chinese imports in August grew by whopping 20.0% year-over-year in dollar terms.
AUD/USD in bullish development
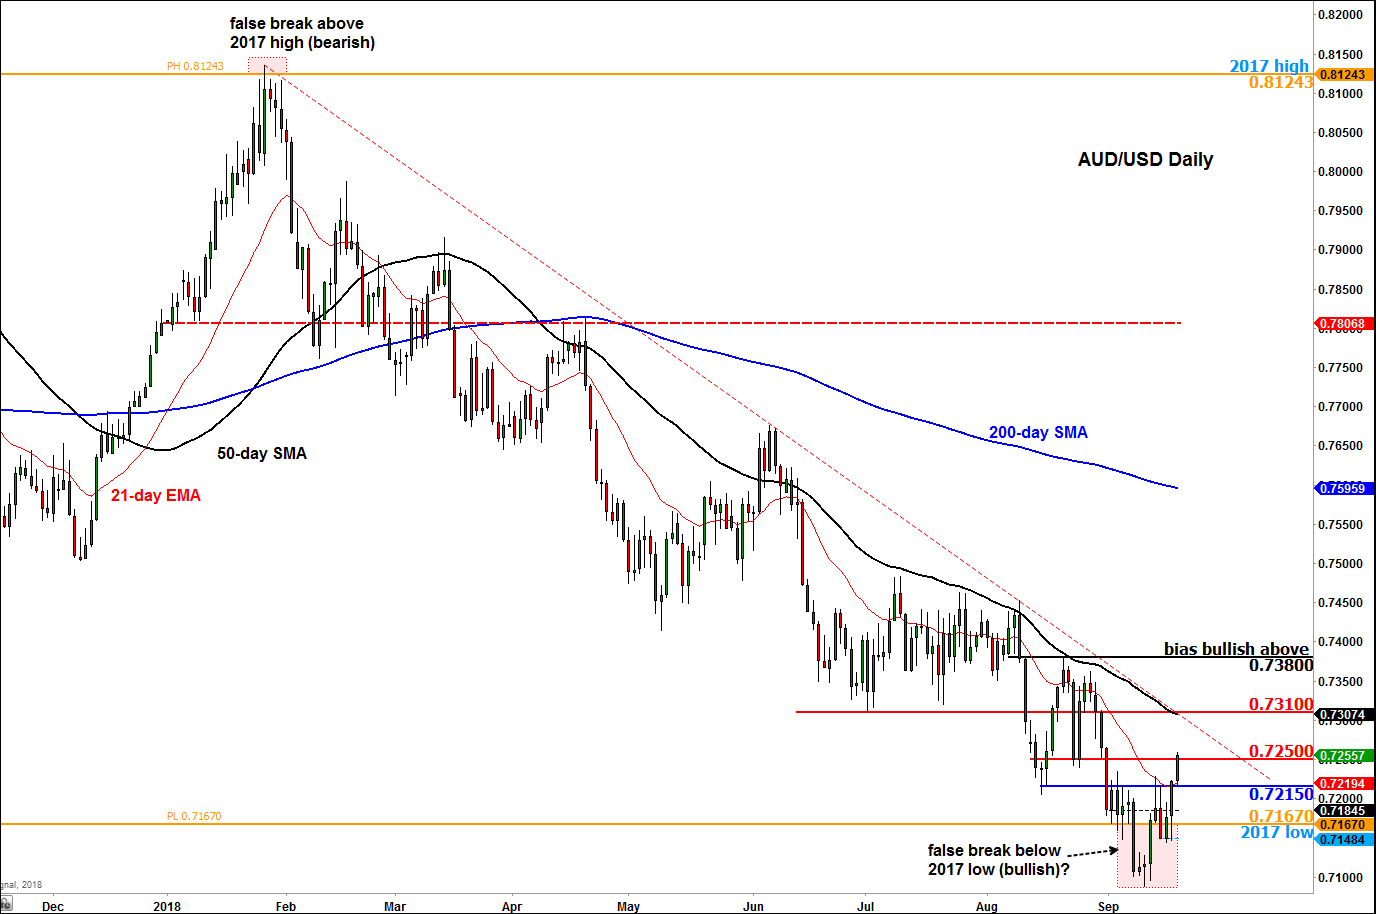
The AUD/USD may have formed a false break reversal pattern when it refused to hold below the 2017 low earlier this month. While the downward trend is still intact, a few resistance levels have now broken down, reducing the bearish pressure. The bulls are happy for as long as rates now remain above last year’s low at 0.7165/70 area, and ideally above the now broken resistance levels such as 0.7215.
At the time of writing the AUD/USD was probing liquidity above 0.7250 resistance with the bulls keeping an eye on the next level of potential resistance at 0.7310. The latter is where the 50-day moving average meets the bearish trend line.
We would turn decisively bullish in the event the Aussie breaks its bearish trend and ideally climbs above the most recent high at 0.7380 – for then we will have our first higher high in place. With the other major commodity pair CAD/USD (i.e. USD/CAD inverted) already breaking higher, sentiment towards the Aussie could improve going forward.
Source: eSignal and FOREX.com.

Open an account in minutes
Experience award-winning platforms with fast and secure execution.
Economic calendar
Web Trader platform
Our sophisticated web-based platform is packed with features.
Related articles

NZD/USD Forecast: Kiwi faces historic breakdown as RBNZ survey looms
NZD/USD is teetering above support that held through the pandemic and Liberation Day turmoil. With RBNZ hawks repeatedly disappointed, today's inflation expectations survey could open the door to a slide towards the GFC lows.

USD/JPY, AUD/JPY: Central Bank Divergence Creates Two-Way Risk
USD/JPY eyes a breakout above 160, while AUD/JPY faces further losses as Fed, RBA and BoJ interest rate expectations diverge.


DXY, GBP/USD, AUD/USD, USD/CAD, USD/JPY, Gold Weekly Technical Outlook 11 16 2026
Sr. Technical Strategist Michael Boutros highlights the levels that matter on the USD Majors, commodities, and equity indices charts this week.

StoneX Financial Ltd (trading as "FOREX.com") is an execution-only service provider. This material, whether or not it states any opinions, is for general information purposes only and it does not take into account your personal circumstances or objectives. This material has been prepared using the thoughts and opinions of the author and these may change. However, FOREX.com does not plan to provide further updates to any material once published and it is not under any obligation to keep this material up to date.
This material is short term in nature and may only relate to facts and circumstances existing at a specific time or day. Nothing in this material is (or should be considered to be) financial, investment, legal, tax or other advice and no reliance should be placed on it. No opinion given in this material constitutes a recommendation by FOREX.com or the author that any particular investment, security, transaction or investment strategy is suitable for any specific person.
The material has not been prepared in accordance with legal requirements designed to promote the independence of investment research. Although FOREX.com is not specifically prevented from dealing before providing this material, FOREX.com does not seek to take advantage of the material prior to its dissemination. This material is not intended for distribution to, or use by, any person in any country or jurisdiction where such distribution or use would be contrary to local law or regulation. For further details see our full non-independent research disclaimer and quarterly summary.