



Technical View GBPUSDs Chart May Be Uglier Than Brexit Infighting
Over the last couple of days, we’ve covered the drama surrounding the vote on Theresa May’s Brexit bill, from last week’s resignation threats, to rumors of its cancellation, to confirmation of its cancellation. With May presently in Brussels negotiating with EU policymakers, the postponed “meaningful vote” is now slated to be held in the New Year, sometime before January 21.
Share this:

Over the last couple of days, we’ve covered the drama surrounding the vote on Theresa May’s Brexit bill, from last week’s resignation threats, to rumors of its cancellation, to confirmation of its cancellation. With May presently in Brussels negotiating with EU policymakers, the postponed “meaningful vote” is now slated to be held in the New Year, sometime before January 21.
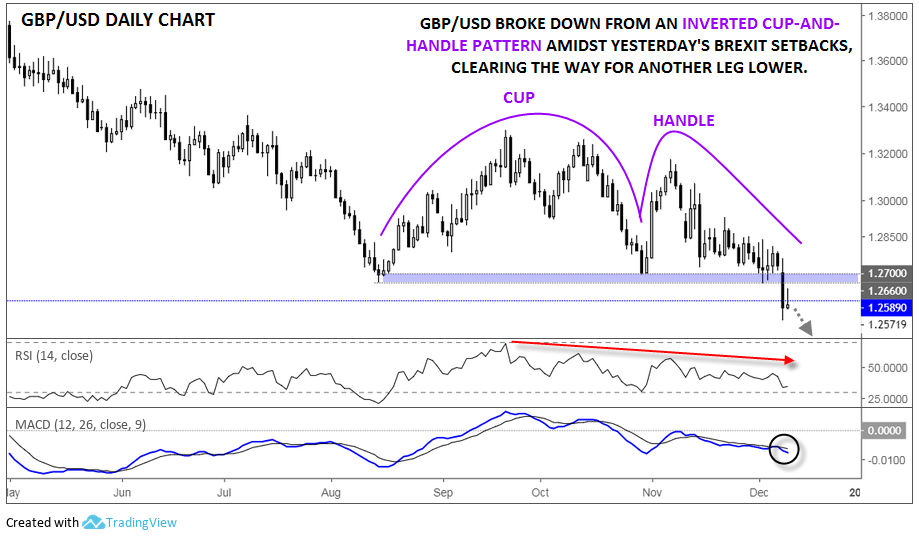
As my colleague Fawad Razaqzada noted yesterday, “Mrs May’s decision was not surprising at all; it just means more delays and more frustration for everyone involved. The markets don’t typically respond well to uncertainty…” Looking at the daily chart of GBP/USD, yesterday’s drama led to a major breakdown below support that could weigh on cable through the end of the year and beyond.
Following a four-month stabilization above the 1.2700 handle, GBP/USD is once again solidly under the control of the bears. Over that period, rates formed a version of an inverted “cup-and-handle” pattern. This formation shows growing selling pressure and, once confirmed by a break below the “rim” of the candle, signals a likely continuation to the downside.
Source: TradingView, FOREX.com
Turning our attention to the secondary indicators, the RSI is in a downtrend of its own since peaking at 69 back in September. Though it was close, the failure to reach “overbought” conditions (>70) keeps this indicator in a bearish configuration. For its part, the MACD indicator is trending lower below both its signal line and the “0” level, showing an accelerating bearish trend.
From a support perspective, GBP/USD appears to be pausing at the June 2017 low near 1.2590, but given the strength of the breakdown (and the lingering fundamental uncertainty), we don’t expect that this support level will hold for long. Below that area, there’s only a minor low around 1.2370 before the October 2016 “flash crash” lows in the 1.2000-1.2100 zone.
At this point, bulls would need to see a confirmed recovery back above the 1.2700 handle to gain any semblance of confidence, ideally accompanied a Brexit breakthrough. Unless/until we see that, the path of least resistance for GBP/USD remains to the downside.
Related tags:
Latest market news




Open an account in minutes
Experience award-winning platforms with fast and secure execution.
Economic calendar
Web Trader platform
Our sophisticated web-based platform is packed with features.
Related articles
NZD/USD Forecast: Kiwi faces historic breakdown as RBNZ survey looms
NZD/USD is teetering above support that held through the pandemic and Liberation Day turmoil. With RBNZ hawks repeatedly disappointed, today's inflation expectations survey could open the door to a slide towards the GFC lows.
USD/JPY, AUD/JPY: Central Bank Divergence Creates Two-Way Risk
USD/JPY eyes a breakout above 160, while AUD/JPY faces further losses as Fed, RBA and BoJ interest rate expectations diverge.

DXY, GBP/USD, AUD/USD, USD/CAD, USD/JPY, Gold Weekly Technical Outlook 11 16 2026
Sr. Technical Strategist Michael Boutros highlights the levels that matter on the USD Majors, commodities, and equity indices charts this week.

StoneX Financial Ltd (trading as "FOREX.com") is an execution-only service provider. This material, whether or not it states any opinions, is for general information purposes only and it does not take into account your personal circumstances or objectives. This material has been prepared using the thoughts and opinions of the author and these may change. However, FOREX.com does not plan to provide further updates to any material once published and it is not under any obligation to keep this material up to date.
This material is short term in nature and may only relate to facts and circumstances existing at a specific time or day. Nothing in this material is (or should be considered to be) financial, investment, legal, tax or other advice and no reliance should be placed on it. No opinion given in this material constitutes a recommendation by FOREX.com or the author that any particular investment, security, transaction or investment strategy is suitable for any specific person.
The material has not been prepared in accordance with legal requirements designed to promote the independence of investment research. Although FOREX.com is not specifically prevented from dealing before providing this material, FOREX.com does not seek to take advantage of the material prior to its dissemination. This material is not intended for distribution to, or use by, any person in any country or jurisdiction where such distribution or use would be contrary to local law or regulation. For further details see our full non-independent research disclaimer and quarterly summary.